


| Scenario | |
|---|---|
| Timeframe | Weekly |
| Recommendation | BUY STOP |
| Entry Point | 115.45 |
| Take Profit | 122.20 |
| Stop Loss | 112.00 |
| Key Levels | 105.00, 112.60, 115.40, 122.20 |
| Alternative scenario | |
|---|---|
| Recommendation | SELL STOP |
| Entry Point | 112.55 |
| Take Profit | 105.00 |
| Stop Loss | 115.00 |
| Key Levels | 105.00, 112.60, 115.40, 122.20 |
Current trend
Shares of RTX Corp., an American aerospace and defense conglomerate, are correcting at 113.80.
On Friday, RBC Capital Markets experts maintained the rating of the emitter's shares at the "Sector Perform" level, increasing the target price from 102.0 dollars to 115.0 dollars against the background of a quarterly report reflecting a 9.0% increase in profit (EPS) to 1.41 dollars instead of 1.30 dollars earlier and organic sales by 10.0% thanks to commercial equipment market. TD Cowen experts maintained the rating on the emitter's shares at the "buy" level and increased the target price from 115.0 dollars to 142.0 dollars. In their opinion, the quotes will continue the uptrend, supported by high demand for defense industry products, which may lead to an increase in cash flow (CFPS) to 6.90 dollars in 2026.
According to the company's financial report for the second quarter, revenue reached 19.8 billion dollars, exceeding analysts' forecasts of 19.28 billion dollars and 18.3 billion dollars over the same period last year. Earnings per share (EPS) increased to 1.41 dollars, higher than both preliminary expectations of 1.29 dollars and profit in the same period a year earlier, which amounted to the same 1.29 dollars.
Support and resistance
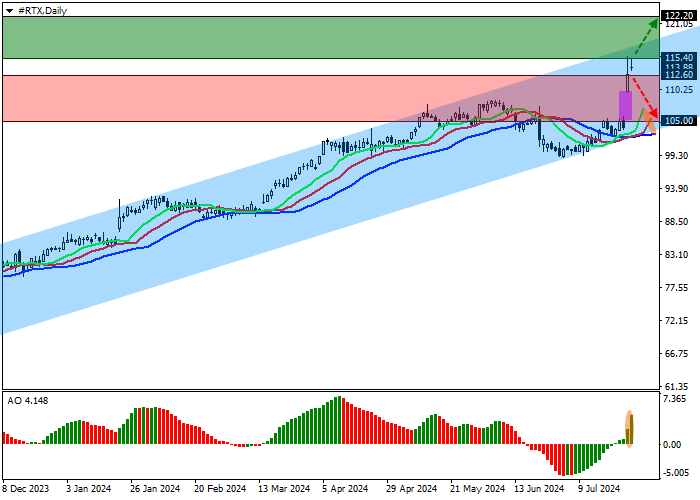
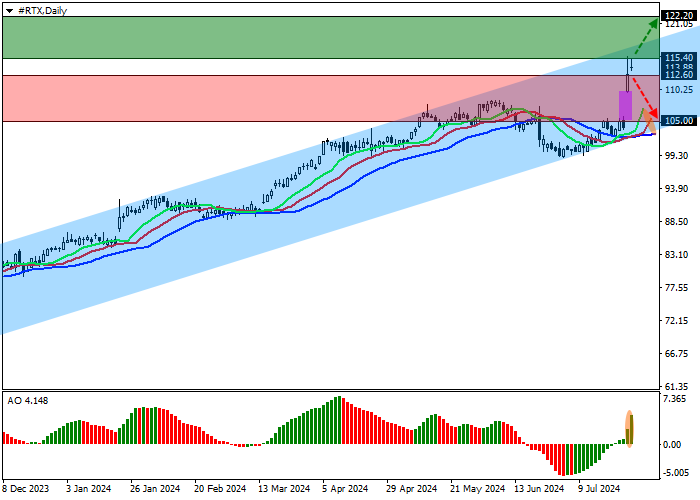
On the D1 chart, the asset is rising within the channel with the boundaries of 120.00–103.00.
Technical indicators are holding the buy signal, which has started to strengthen again: the Alligator indicator expands its range of EMA fluctuations, and fast EMAs are located above the signal line, while AO oscillator, being close to the transition level, forms ascending bars.
Support levels: 112.60, 105.00.
Resistance levels: 115.40, 122.20.
Trading tips
If the global growth of the asset continues and the price consolidates above the resistance level of 115.40, one may open long positions with the target of 122.20 and stop-loss of 112.00. Implementation period: 7 days and more.
If the asset continues to decline and the price consolidates below the minimum of 112.60, one can open short positions with the target of 105.00 and stop-loss of 115.00.
면책 조항: 본 게시글에 표현된 견해는 전적으로 작성자의 견해이며 Followme의 공식 입장을 대변하지 않습니다. Followme는 제공된 정보의 정확성, 완전성 또는 신뢰성에 대해 책임을 지지 않으며, 서면으로 명시적으로 언급되지 않는 한 해당 내용을 기반으로 취해진 어떠한 조치에 대해서도 책임을 지지 않습니다.

