


| Scenario | |
|---|---|
| Timeframe | Weekly |
| Recommendation | SELL LIMIT |
| Entry Point | 0.6575 |
| Take Profit | 0.6490 |
| Stop Loss | 0.6605 |
| Key Levels | 0.6450, 0.6490, 0.6575, 0.6703 |
| Alternative scenario | |
|---|---|
| Recommendation | BUY STOP |
| Entry Point | 0.6610 |
| Take Profit | 0.6703 |
| Stop Loss | 0.6570 |
| Key Levels | 0.6450, 0.6490, 0.6575, 0.6703 |
Current trend
As a result of the publication of positive US macroeconomic statistics last week, the AUD/USD pair consolidated below the support level of 0.6575.
The American dollar is supported by the Q2 gross domestic product (GDP) data. It increased from 1.4% to 2.8% QoQ against the forecast of 2.0%, and June core durable goods orders amounted to 0.5%, exceeding the forecast of 0.2%, reflecting a sustainable recovery of the national economy. In addition, the June PCE price index was as expected at 2.5% YoY. However, the core indicator increased by 2.6% relative to the 2.5% estimate, as a result of which the probability of the US Fed cutting the interest rate at the September meeting, according to the Chicago Mercantile Exchange (CME) FedWatch Instrument, decreased from 88.5% to 87.7%. It is worth noting that the markets have already priced this adjustment in the cost of borrowing into the current price of the American dollar, and any changes will significantly affect its exchange rate.
The Australian currency is weakening after the publication of PMIs. The June preliminary composite PMI was 50.2 points, below the forecast of 50.4 points and the previous value of 50.7 points, and the service PMI was 50.8 points against the estimates of 50.9 points and 51.2 points previously, putting pressure on the Australian dollar.
The overall downward trend of the AUD/USD pair is likely to continue after some upward correction in the medium term.
Support and resistance
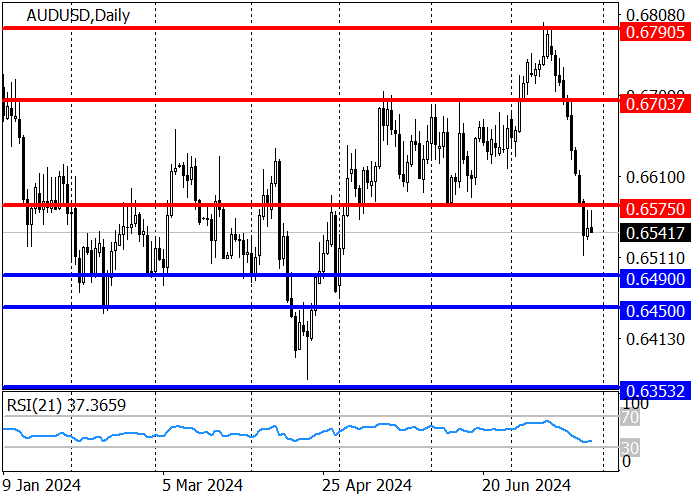
After the breakdown of the key support level of 0.6575 last week, the long-term trend reversed downwards. The nearest resistance level is 0.6575, where new short positions, with the target at 0.6490 are relevant.
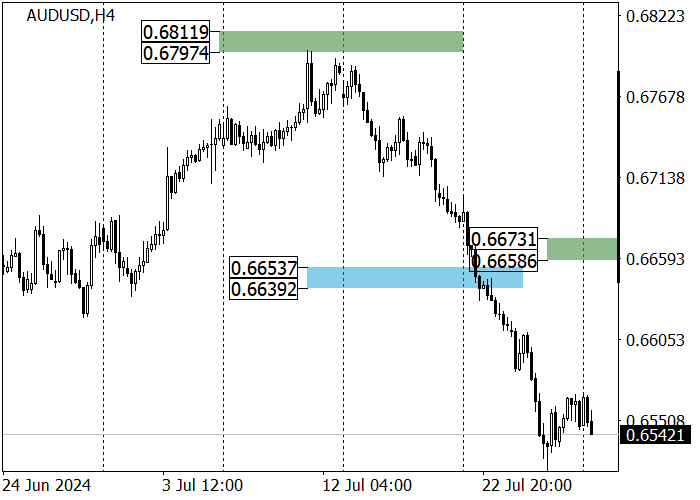
The medium-term trend reversed downwards after a breakdown through the key support area of the previous trend of 0.6653–0.6639, and the sell target is zone 2 (0.6508–0.6494). After a breakdown, a decline to zone 3 (0.6363–0.6349) may follow. The key resistance area is shifting to the area of 0.6673–0.6658, and after reaching it, short positions, with the target at 0.6515 are relevant.
Resistance levels: 0.6575, 0.6703.
Support levels: 0.6490, 0.6450.
Trading tips
Short positions may be opened from 0.6575, with the target at 0.6490 and stop loss 0.6605. Implementation period: 9–12 days.
Long positions may be opened above 0.6605, with the target at 0.6703 and stop loss 0.6570.
면책 조항: 본 게시글에 표현된 견해는 전적으로 작성자의 견해이며 Followme의 공식 입장을 대변하지 않습니다. Followme는 제공된 정보의 정확성, 완전성 또는 신뢰성에 대해 책임을 지지 않으며, 서면으로 명시적으로 언급되지 않는 한 해당 내용을 기반으로 취해진 어떠한 조치에 대해서도 책임을 지지 않습니다.

