


| Scenario | |
|---|---|
| Timeframe | Weekly |
| Recommendation | SELL STOP |
| Entry Point | 0.8390 |
| Take Profit | 0.8361, 0.8300 |
| Stop Loss | 0.8417 |
| Key Levels | 0.8300, 0.8361, 0.8392, 0.8453, 0.8483, 0.8514 |
| Alternative scenario | |
|---|---|
| Recommendation | BUY STOP |
| Entry Point | 0.8453 |
| Take Profit | 0.8483, 0.8514 |
| Stop Loss | 0.8425 |
| Key Levels | 0.8300, 0.8361, 0.8392, 0.8453, 0.8483, 0.8514 |
Current trend
The EUR/GBP pair is moving within a long-term downtrend but its dynamics have been ambiguous this week amid uncertainty about the next steps of the European Central Bank (ECB) and the Bank of England.
At the meeting of the European regulator last week, economists left interest rates unchanged. However, they hinted that if inflation slowed, and the composite PMI, which had adjusted from 52.8 points to 51.9 points in July, developed negative dynamics, monetary policy easing would continue. Experts believe that financial authorities may turn to active measures in September.
The meeting of the Bank of England is due on August 1, and their further steps look even more uncertain. British inflation is at the target level of 2.0% and may fall below it soon but the July composite PMI increased from 52.1 points to 52.4 points, reflecting price growth risks. According to the latest officials’ statements, there is also no consensus among them regarding further actions. Some economists, such as Swati Dhingra, advocate a “dovish” course. However, most analysts, including Catherine Mann and Hugh Pill, are not ready. As a result, experts consider the probability of the interest rate cut in August at 50.0%.
In this situation, a decrease in investor activity and low volatility of the EUR/GBP pair are expected until the publication of the results of the Bank of England’s meeting next week.
Support and resistance
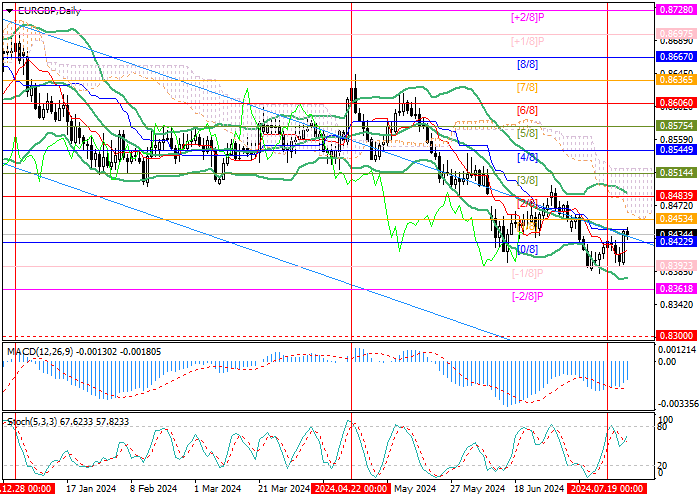
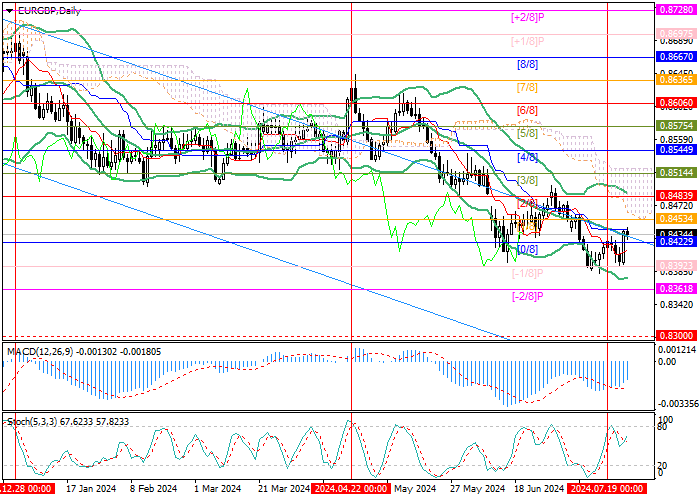
The trading instrument is trying to consolidate above the middle line of Bollinger Bands to continue growth to the area of 0.8483 (Murrey level [2/8]) and 0.8514 (Murrey level [3/8]). In case of consolidation below 0.8392 (Murrey level [–1/8]), a decline to the area of 0.8361 (Murrey level [–2/8]) and 0.8300 (Murrey level [0/8], W1) is expected.
Technical indicators do not give a single signal: Bollinger bands are directed downwards, Stochastic is upwards, and the MACD histogram is decreasing in the negative zone.
Resistance levels: 0.8453, 0.8483, 0.8514.
Support levels: 0.8392, 0.8361, 0.8300.
Trading tips
Short positions may be opened below 0.8392, with the targets of 0.8361, 0.8300 and stop loss 0.8417. Implementation period: 5–7 days.
Long positions may be opened above 0.8453, with the targets at 0.8483, 0.8514 and stop loss 0.8425.
면책 조항: 본 게시글에 표현된 견해는 전적으로 작성자의 견해이며 Followme의 공식 입장을 대변하지 않습니다. Followme는 제공된 정보의 정확성, 완전성 또는 신뢰성에 대해 책임을 지지 않으며, 서면으로 명시적으로 언급되지 않는 한 해당 내용을 기반으로 취해진 어떠한 조치에 대해서도 책임을 지지 않습니다.

