

| Scenario | |
|---|---|
| Timeframe | Weekly |
| Recommendation | SELL STOP |
| Entry Point | 0.8785 |
| Take Profit | 0.8728, 0.8667 |
| Stop Loss | 0.8835 |
| Key Levels | 0.8667, 0.8728, 0.8789, 0.8911, 0.9033, 0.9094 |
| Alternative scenario | |
|---|---|
| Recommendation | BUY STOP |
| Entry Point | 0.8915 |
| Take Profit | 0.9033, 0.9094 |
| Stop Loss | 0.8850 |
| Key Levels | 0.8667, 0.8728, 0.8789, 0.8911, 0.9033, 0.9094 |
Current trend
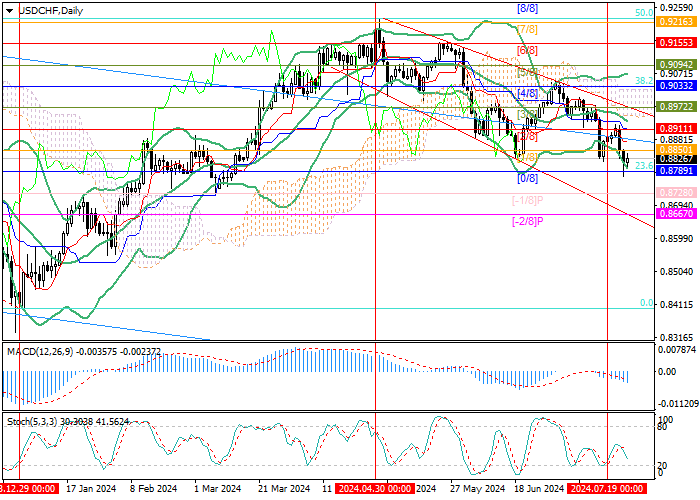
The USD/CHF pair yesterday tested the 0.8789 mark (Murrey level [0/8]) but has not yet been able to consolidate below it, since the US currency is under pressure amid investors' expectations of the imminent start of monetary policy easing by the US Federal Reserve.
However, statistics published yesterday on gross domestic product (GDP) for the second quarter recorded an increase of 2.8% with a forecast of 2.0%, which reflected a slowdown in the decline of the trading instrument. Analysts fear that a significant expansion of the economy will contribute to the preservation of inflationary risks, which, in turn, may cause the regulator to postpone interest rate cuts or make just one correction in the cost of borrowing this year instead of two. Today, data on the index of price expenditures on personal consumption for June will be published: if the indicator decreases from 2.6% to 2.5% YoY, confirming the continuation of a decrease in inflationary pressure, the dollar may begin to lose its position again.
On the other hand, investors expect that due to the acceleration of inflation in the country, the Swiss National Bank may interrupt the cycle of monetary policy easing that began in the fourth quarter. In April, the consumer price index (CPI) increased from 1.0% to 1.4% and has not returned to the minimum annual values since then.
Thus, in the medium term, the continuation of the downward dynamics of the USD/CHF pair seems to be a more likely scenario.
Support and resistance
The asset is located at 0.8789 (Murrey level [0/8]), the breakdown of which will allow quotes to strengthen the downtrend towards the targets of 0.8728 (Murrey level [˗1/8]) and 0.8667 (Murrey level [˗2/8]). The key level for the "bulls" is 0.8911 (Murrey level [2/8], the central line of Bollinger Bands), consolidation above which will cause a resumption of growth to 0.9033 (Murrey level [4/8], 38.2% Fibonacci retracement), 0.9094 (Murrey level [5/8]).
Technical indicators confirm the continuation of the downtrend: Bollinger Bands and Stochastic are reversing down, MACD is growing in the negative zone.
Resistance levels: 0.8911, 0.9033, 0.9094.
Support levels: 0.8789, 0.8728, 0.8667.
Trading tips
Short positions should be opened below 0.8789 with targets of 0.8728, 0.8667 and stop-loss around 0.8835. Implementation period: 5–7 days.
Long positions can be opened above the 0.8911 mark with targets of 0.9033, 0.9094 and stop-loss around 0.8850.
면책 조항: 본 게시글에 표현된 견해는 전적으로 작성자의 견해이며 Followme의 공식 입장을 대변하지 않습니다. Followme는 제공된 정보의 정확성, 완전성 또는 신뢰성에 대해 책임을 지지 않으며, 서면으로 명시적으로 언급되지 않는 한 해당 내용을 기반으로 취해진 어떠한 조치에 대해서도 책임을 지지 않습니다.