


| Scenario | |
|---|---|
| Timeframe | Weekly |
| Recommendation | SELL STOP |
| Entry Point | 1.0793 |
| Take Profit | 1.0708 |
| Stop Loss | 1.0840 |
| Key Levels | 1.0708, 1.0793, 1.0909, 1.1021 |
| Alternative scenario | |
|---|---|
| Recommendation | BUY STOP |
| Entry Point | 1.0909 |
| Take Profit | 1.1021 |
| Stop Loss | 1.0860 |
| Key Levels | 1.0708, 1.0793, 1.0909, 1.1021 |
Current trend
Despite the decline of the American dollar, the EUR/USD pair remains in a correction trend at 1.0837.
Yesterday’s macroeconomic statistics could not support the euro. The July French manufacturing PMI changed from 45.4 points to 44.1 points, and the German one from 43.5 points to 42.6 points. French service PMI amounted to 50.7 points, higher than 49.6 points earlier. However, the German service PMI reached 52.0 points compared to 53.1 points earlier. As a result, EU manufacturing PMI changed from 45.8 points to 45.6 points, and EU service PMI from 51.9 points to 45.6 points. The EU composite PMI fell from 50.4 points to 48.7 points, returning to the red zone for the first time since March and reflecting the slowdown in the European economy. However, it increased the likelihood of interest rate cuts by European Central Bank (ECB) officials in September and December. Meanwhile, the GfK Group consumer climate index increased from –21.6 points to –18.4 points in August, exceeding estimates of –21.1 points, amid slowing inflation and a recovery in household incomes due to higher wages.
The American dollar is trading at 103.90 in USDX amid real estate data. Despite an increase in building permits to 1.454M, sales are falling, and after negative dynamics in the existing home sales, the indicator for new home sales fell from 621.0K to 617.0K, the year’s low.
In these conditions, a continuation of the downward movement of the EUR/USD pair looks like the most likely scenario.
Support and resistance
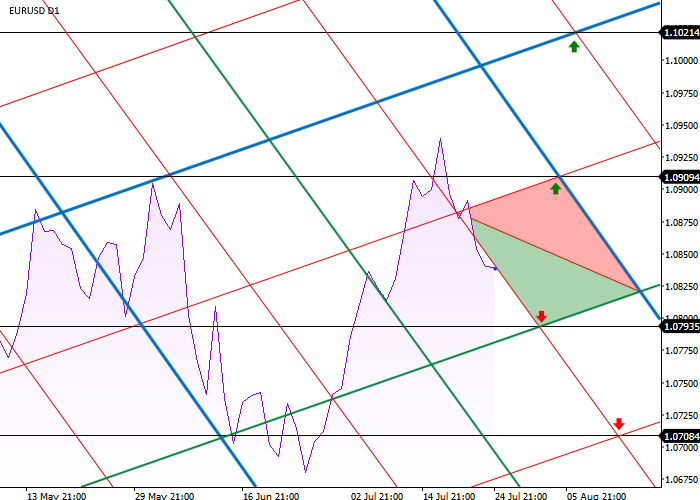
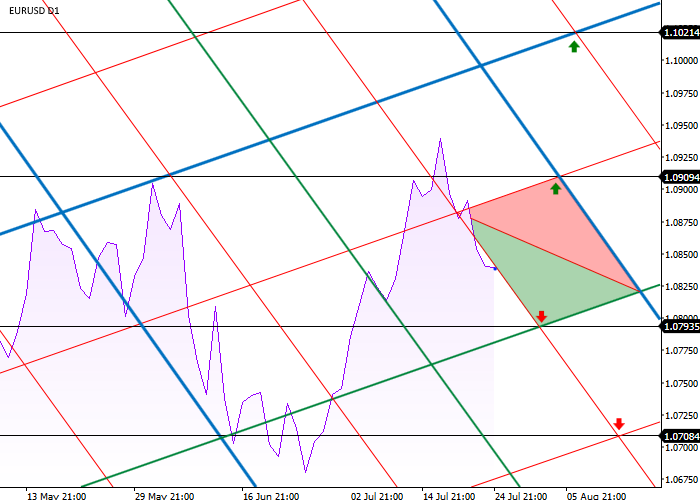
On the daily chart, the trading instrument completes the movement between the first-order levels (I), approaching the right resistance level of the first order (I) at 1.0850. The most likely scenario is a decline to the crosshair of the right support of the second order (II) and the left support of the third order (III) at 1.0793, and then to the crosshair of the left support of the third order (III) and the right support of the third order (III) at 1.0708.
After growth and a breakout of the nearest level of the third order (III), the price may reach the crosshair of the left resistance of the third order (III) and the right resistance of the first order (I) at 1.0909 and the crosshair of the right resistance of the third order (III) and the left resistance of the first order at (I) at 1.1021.
Resistance levels: 1.0909, 1.1021.
Support levels: 1.0793, 1.0708.
Trading tips
Short positions may be opened after the price consolidates below 1.0793, with the target at 1.0708. Stop loss is 1.0840. Implementation period: 7 days or more.
Long positions may be opened after the price consolidates above 1.0909, with the target at 1.1021. Stop loss is 1.0860.
면책 조항: 본 게시글에 표현된 견해는 전적으로 작성자의 견해이며 Followme의 공식 입장을 대변하지 않습니다. Followme는 제공된 정보의 정확성, 완전성 또는 신뢰성에 대해 책임을 지지 않으며, 서면으로 명시적으로 언급되지 않는 한 해당 내용을 기반으로 취해진 어떠한 조치에 대해서도 책임을 지지 않습니다.

