


| Scenario | |
|---|---|
| Timeframe | Weekly |
| Recommendation | BUY STOP |
| Entry Point | 562.55 |
| Take Profit | 593.75, 625.00 |
| Stop Loss | 538.70 |
| Key Levels | 512.15, 531.25, 562.50, 593.75, 625.00 |
| Alternative scenario | |
|---|---|
| Recommendation | BUY LIMIT |
| Entry Point | 531.25 |
| Take Profit | 593.75, 625.00 |
| Stop Loss | 518.60 |
| Key Levels | 512.15, 531.25, 562.50, 593.75, 625.00 |
Current trend
Shares of Adobe Inc., a leading American software developer, have been declining for the third week against the medium-term upward trend.
The negative dynamics are a correction since the general fundamental background remains favorable. Investors positively assess the company’s Q2 financial report: revenue increased by 10.0% compared to the same period a year earlier to 5.31B dollars, and adjusted earnings per share – by 15.0% to 3.49 dollars, ahead of expert forecasts. Analysts expect a further increase in profit due to the development of new products based on artificial intelligence (AI). The leading one is the Firefly workflow automation service, which has received positive customer reviews. This spring, the corporation also introduced the Acrobat AI Assistant service to summarize documents, answer questions based on their content, and model solutions to marketing problems.
In addition, in the medium term, monetary factors support the stock market. Investors expect the first cut in the US Fed interest rate in September and another one before the end of the year. It will support the economy and ensure a general increase in demand. In general, a resumption of positive dynamics soon seems quite possible.
Support and resistance
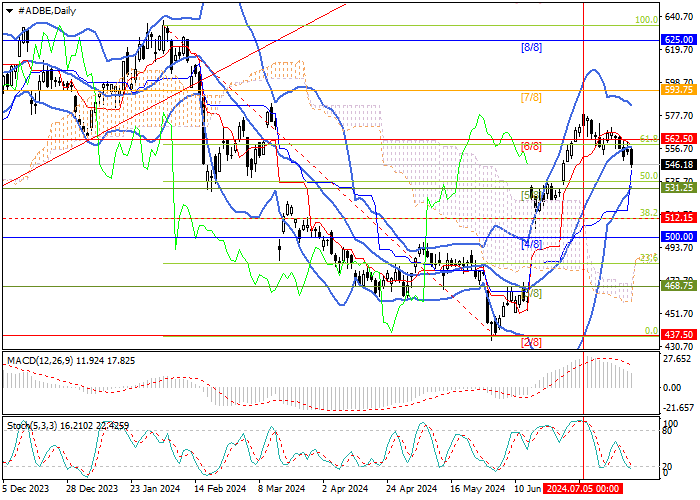
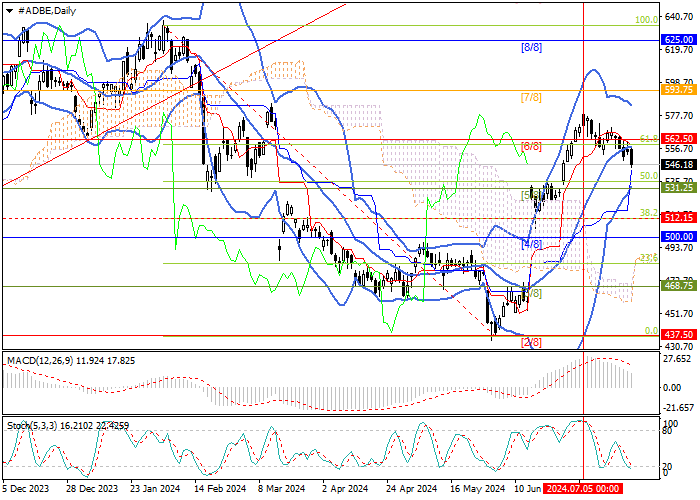
The trading instrument has consolidated below 562.50 (Murrey level [6/8], the middle line of Bollinger bands, Fibonacci correction 61.8%), which may lead to a decline around 531.25 (Murrey level [5/8]), 512.15 (Fibonacci correction 38.2%). A reverse breakout of 562.50 will ensure growth to 593.75 (Murrey level [7/8]) and 625.00 (Murrey level [8/8]).
Technical indicators allow for continued growth. Bollinger bands are directed upward, and the MACD histogram is decreasing in the positive zone. Stochastic is approaching the oversold zone, not excluding an upward reversal. Resistance levels: 562.50, 593.75, 625.00.
Support levels: 531.25, 512.15.
Trading tips
Long positions may be opened above 562.50 or at a reversal at 531.25, with the targets at 593.75 and 625.00 and stop losses 538.70 and 518.60, respectively. Implementation period: 5–7 days.
면책 조항: 본 게시글에 표현된 견해는 전적으로 작성자의 견해이며 Followme의 공식 입장을 대변하지 않습니다. Followme는 제공된 정보의 정확성, 완전성 또는 신뢰성에 대해 책임을 지지 않으며, 서면으로 명시적으로 언급되지 않는 한 해당 내용을 기반으로 취해진 어떠한 조치에 대해서도 책임을 지지 않습니다.

