


| Scenario | |
|---|---|
| Timeframe | Weekly |
| Recommendation | SELL STOP |
| Entry Point | 59300.00 |
| Take Profit | 56250.00 |
| Stop Loss | 61700.00 |
| Key Levels | 56250.00, 59375.00, 63900.00, 65625.00, 68750.00 |
| Alternative scenario | |
|---|---|
| Recommendation | BUY STOP |
| Entry Point | 63930.00 |
| Take Profit | 65625.00, 68750.00 |
| Stop Loss | 62500.00 |
| Key Levels | 56250.00, 59375.00, 63900.00, 65625.00, 68750.00 |
Current trend
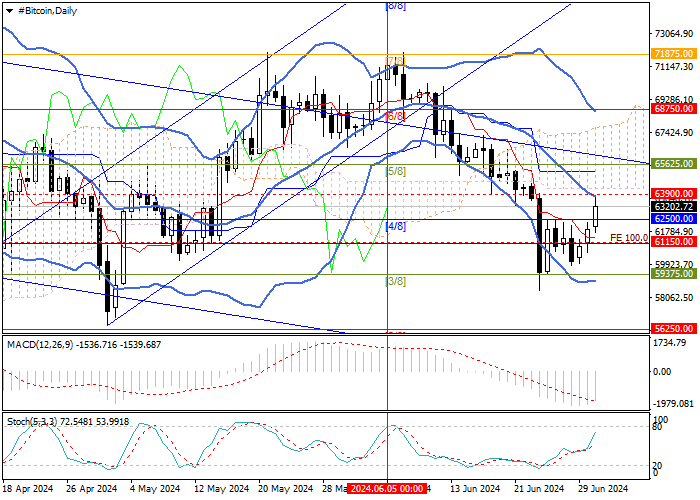
Last week, the BTC/USD pair demonstrated ambiguous dynamics: after renewing the annual low of 58435.00, it returned to the 62844.15 mark.
The world’s first cryptocurrency came under pressure from reports that in July, payments to clients of the Mt. Gox platform, which went bankrupt in 2014, will begin, the total amount of which may reach 9.4B dollars (about 140.0K BTC). Experts fear that the introduction of significant volumes of currency to the market, most of which will be sold, will serve as a medium-term pressure factor on the entire sector.
By the end of the week, the price partially recovered its position after the publication of key US macroeconomic data. The Q1 gross domestic product (GDP) slowed from 3.4% to 1.4%, and the May price index of private consumption expenditures – from 0.3% to 0.1% MoM and from 2.8% to 2.6% YoY. The inflationary pressure is weakening, increasing the likelihood of US Fed officials switching to the “dovish” rhetoric in September and supporting assets alternative to the dollar. In addition, last week, the inflow of funds into Bitcoin ETFs resumed, amounting to 137.2M dollars over the last four sessions.
Support and resistance
The trading instrument is testing the middle line of Bollinger Bands 63900.00, after breakout it may return to the area of 65625.00 (Murrey level [5/8]) and 68750.00 (Murrey level [6/8]). In case of a breakdown of 59375.00 (Murrey level [3/8]), a decline to 56250.00 (Murrey level [2/8]) is expected.
Technical indicators do not give a single signal. Bollinger Bands are directed downwards, confirming the continuation of the downward trend, the MACD histogram is decreasing in the negative zone, and Stochastic is directed upwards, not excluding a correction.
Resistance levels: 63900.00, 65625.00, 68750.00.
Support levels: 59375.00, 56250.00.
Trading tips
Short positions may be opened below 59375.00, with the target at 56250.00 and stop loss 61700.00. Implementation period: 5–7 days.
Long positions may be opened above 63900.00, with the targets of 65625.00, 68750.00, and stop loss 62500.00.
면책 조항: 본 게시글에 표현된 견해는 전적으로 작성자의 견해이며 Followme의 공식 입장을 대변하지 않습니다. Followme는 제공된 정보의 정확성, 완전성 또는 신뢰성에 대해 책임을 지지 않으며, 서면으로 명시적으로 언급되지 않는 한 해당 내용을 기반으로 취해진 어떠한 조치에 대해서도 책임을 지지 않습니다.

