


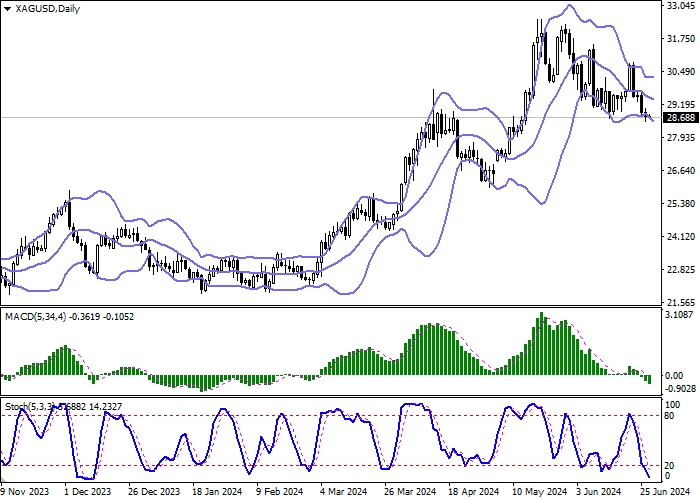
| Scenario | |
|---|---|
| Timeframe | Intraday |
| Recommendation | SELL STOP |
| Entry Point | 28.56 |
| Take Profit | 27.60 |
| Stop Loss | 29.00 |
| Key Levels | 27.33, 27.60, 28.00, 28.56, 29.00, 29.35, 29.84, 30.15 |
| Alternative scenario | |
|---|---|
| Recommendation | BUY STOP |
| Entry Point | 29.00 |
| Take Profit | 29.84 |
| Stop Loss | 28.56 |
| Key Levels | 27.33, 27.60, 28.00, 28.56, 29.00, 29.35, 29.84, 30.15 |
Current trend
The XAG/USD pair declines slightly during the morning session on June 27, holding near 28.70. Activity in the market remains quite low, as trading participants expect the emergence of new drivers of movement.
In particular, today the final estimates for US Gross Domestic Product (GDP) for the first quarter will be published: analysts expect that the figure will be revised from 1.3% to 1.4%. In addition, the market will receive May data on Durable Goods Orders: it is expected that their number will decrease by 0.1% after growing by 0.6% in the previous month, and the Durable Goods Orders excluding Transportation will slow down from 0.4% to 0.2%. Investors will also pay attention to May statistics on Pending Home Sales, which are likely to increase 2.5% after –7.7% in the previous month. During the day, data on jobless claims will be published: it is expected that Initial Jobless Claims for the week ended June 21 will decrease from 238.0 thousand to 236.0 thousand, and Continuing ones (for the week ended June 14) — from 1.828 million to 1.820 million.
On Friday at 14:30 (GMT 2), May statistics on the Personal Consumption Expenditures - Price Index, which is a key inflation indicator for the US Federal Reserve, will be presented. The Core annual rate is forecast to slow from 2.8% to 2.6% and on a monthly basis from 0.2% to 0.1%. Reducing inflation risks in the country may allow the regulator to implement plans to ease monetary policy: officials expect that the interest rate in 2024 may be reduced from 5.50% to 5.10%.
Support and resistance
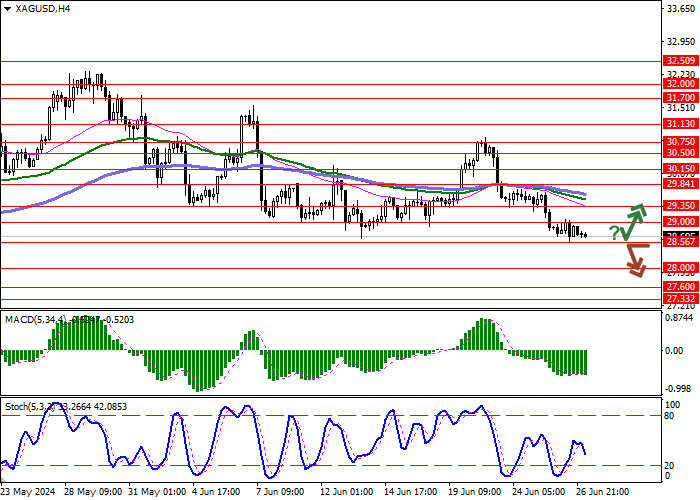
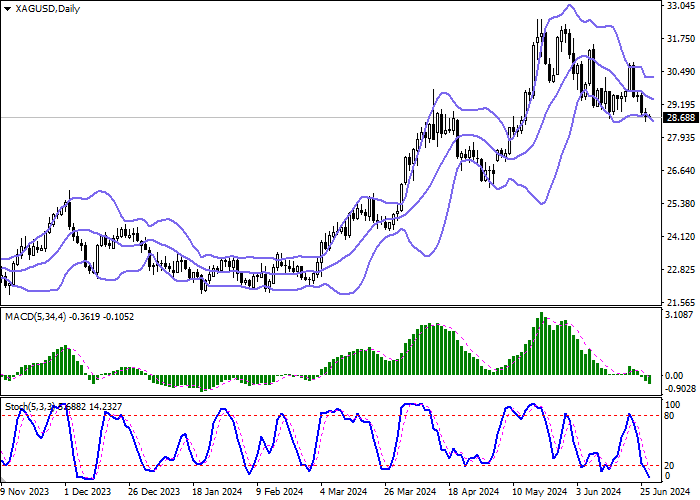
Bollinger Bands in D1 chart demonstrate quite active decrease. The price range expands from below, making way for new local lows for the "bears". MACD is going down preserving a stable sell signal (located below the signal line). The indicator is actively trying to consolidate below the zero level. Stochastic retains a steady downtrend but is located in close proximity to its lows, which indicates the risks of oversold silver in the ultra-short term.
Resistance levels: 29.00, 29.35, 29.84, 30.15.
Support levels: 28.56, 28.00, 27.60, 27.33.
Trading tips
Short positions may be opened after a breakdown of 28.56 with the target at 27.60. Stop-loss — 29.00. Implementation time: 1-2 days.
A rebound from 28.56 as from support followed by a breakout of 29.00 may become a signal for opening new long positions with the target at 29.84. Stop-loss — 28.56.
면책 조항: 본 게시글에 표현된 견해는 전적으로 작성자의 견해이며 Followme의 공식 입장을 대변하지 않습니다. Followme는 제공된 정보의 정확성, 완전성 또는 신뢰성에 대해 책임을 지지 않으며, 서면으로 명시적으로 언급되지 않는 한 해당 내용을 기반으로 취해진 어떠한 조치에 대해서도 책임을 지지 않습니다.

