


BTCUSD (Bitcoin) has been in a strong uptrend since November 2022. The previous all-time peak was seen on November 8, 2021 and was broken in March 2024 when Bitcoin made a new all-time high at 73794 on March 14, 2024. It has since seen a pull back which reached a low of 56500 on May 1, 2024 and is now turning higher again. Today, we will take a look at the bigger picture of Bitcoin, what are the upside targets and any possible detours which can take place.
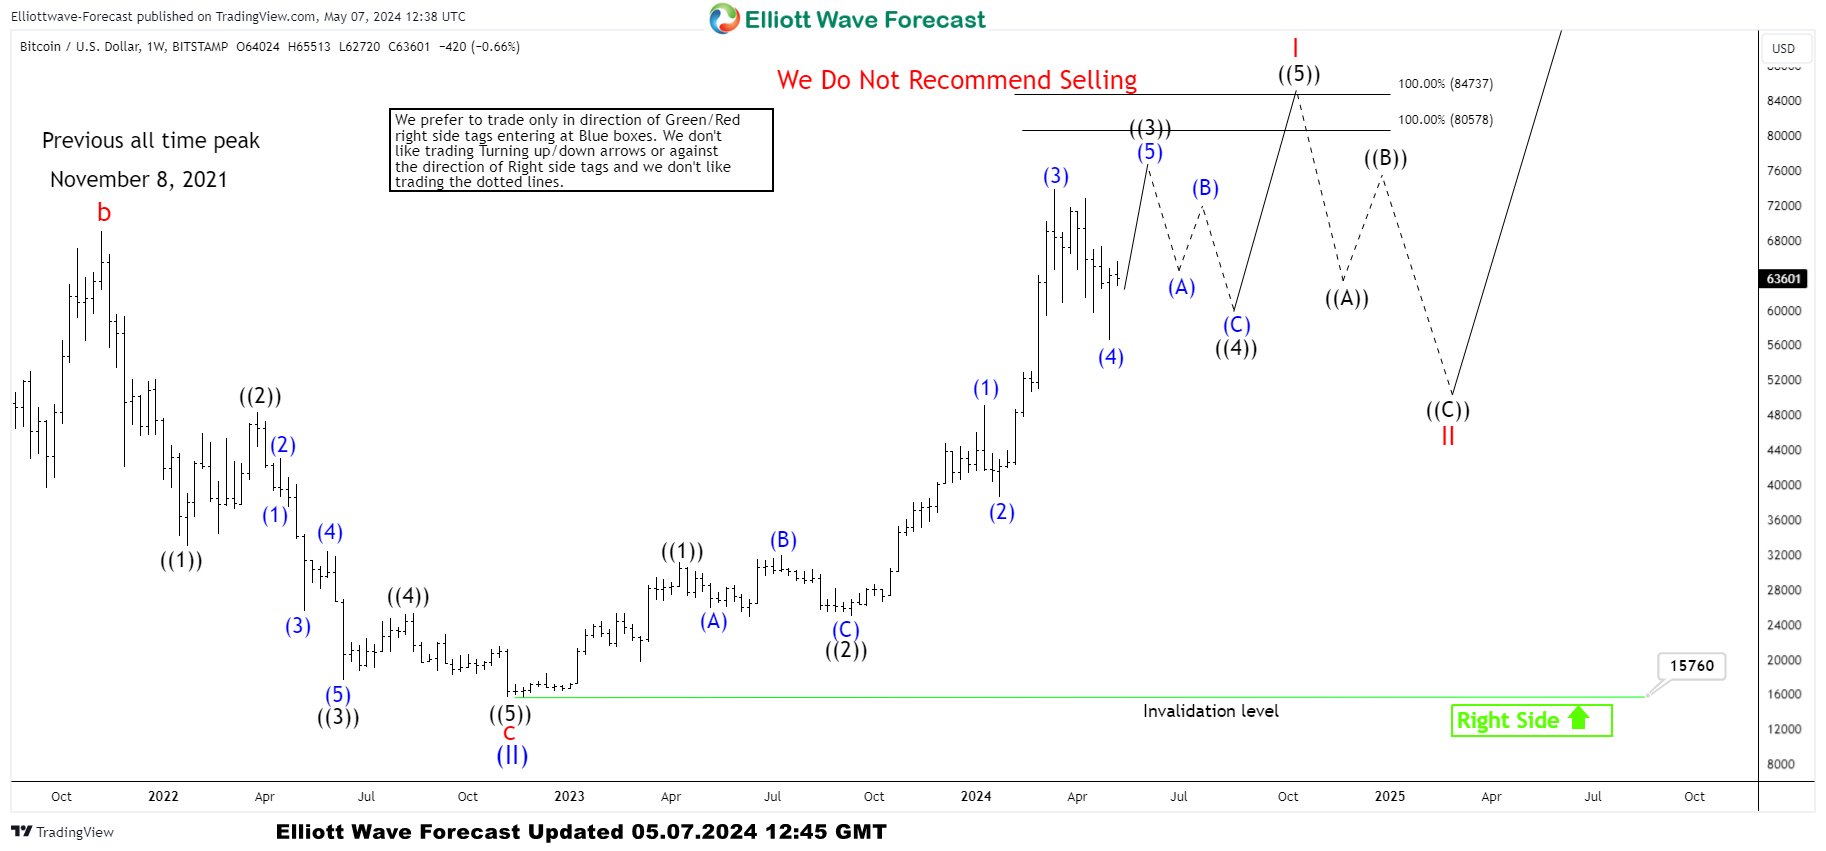
BTCUSD Weekly Elliott Wave Chart 7 May 2024
The Bitcoin chart below shows it completed an expanded FLAT correction in November 2022 and resumed the rally. Wave ((1)) ended at 31035, wave ((2)) completed at 24920 after which it resumed the rally in wave ((3)). Within wave ((3)), wave (1) competed at 49048, wave (2) completed at 38505, wave (3) ended at 73794, and wave (4) is also proposed to be over at 56500. As dips hold above this level, we are expecting a continuation higher in wave (5) of ((3)). Inverse 123.6 Fibonacci extension of wave (4) pullback comes at 77379. After a new high to complete wave ((3)), we expect another pullback in wave ((4)) to correct the cycle from September 2023 low and higher again in wave ((5)) toward 80578 - 84737 area which is 100% Fibonacci extension of the first leg up from all-time low projected higher from November 2022 low. We have two different 100% Fibonacci extension levels based on whether we count wave (I) at April 2021 or November 2021.
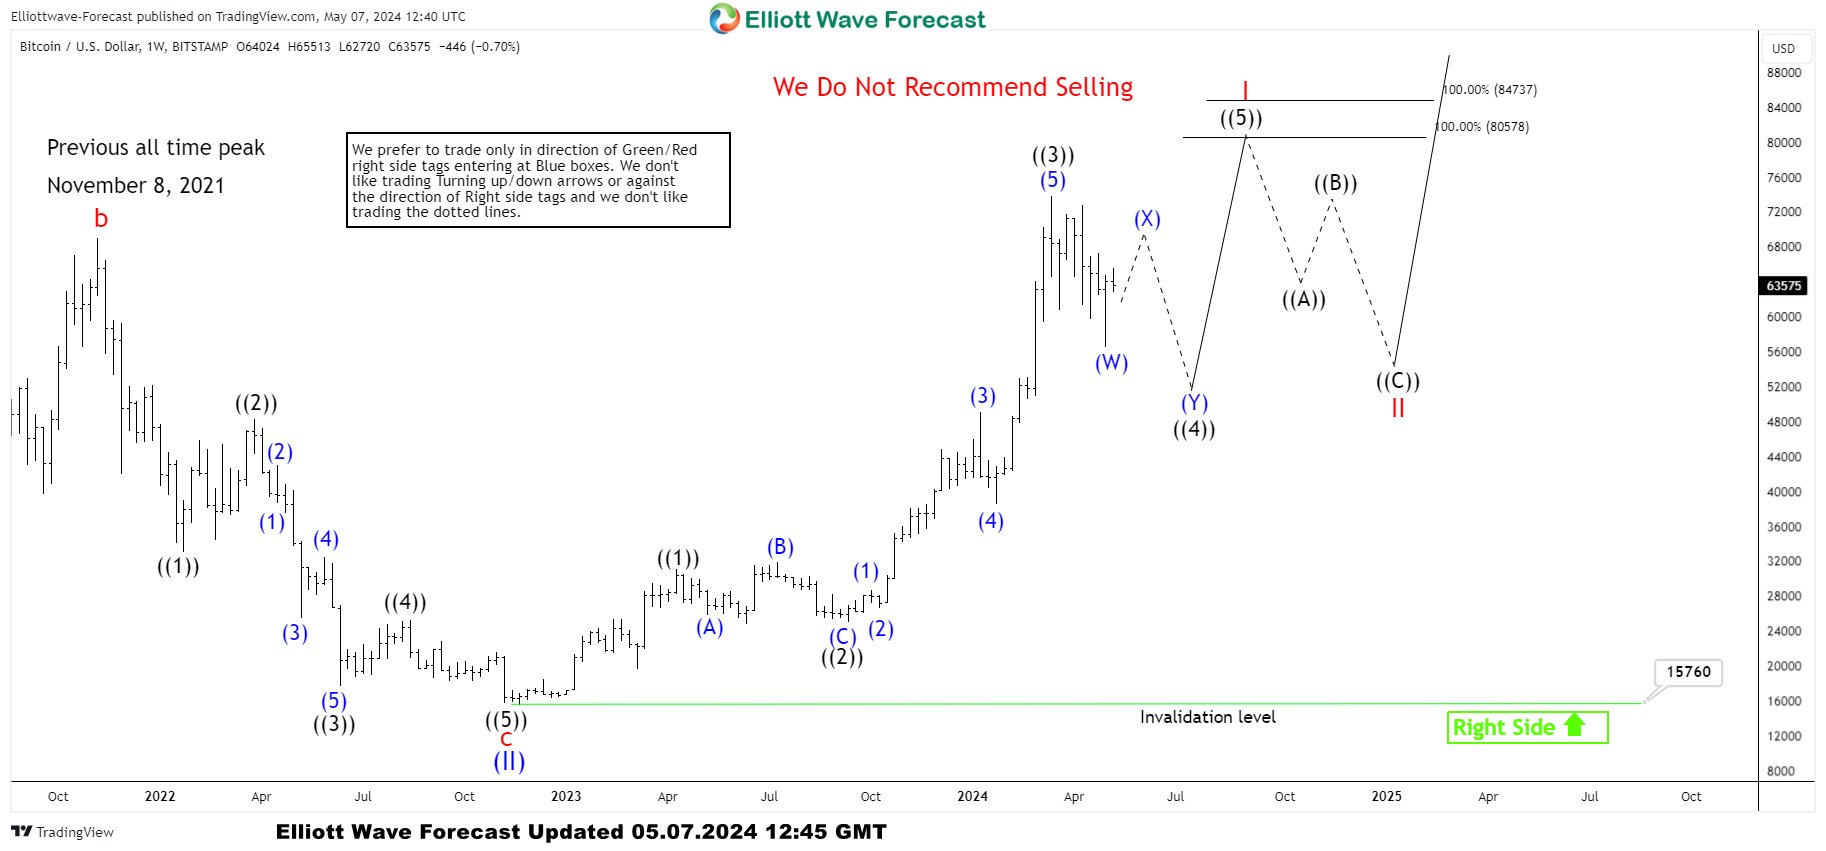
BTCUSD Weekly Elliott Wave Chart 7 May 2024 [Alternate View]
The Bitcoin chart below shows the possibility that wave ((3)) is already in place and we end up with a double three Elliott wave correction in wave ((4)). If we fail to break above the high at 73794 and see a break lower, that will support the alternate view. The target area on the upside remains to be between 80578 - 84737. We don't recommend selling and in case of a double correction lower and will be looking for a buying opportunity at the next extreme area in case we get a double correction lower.
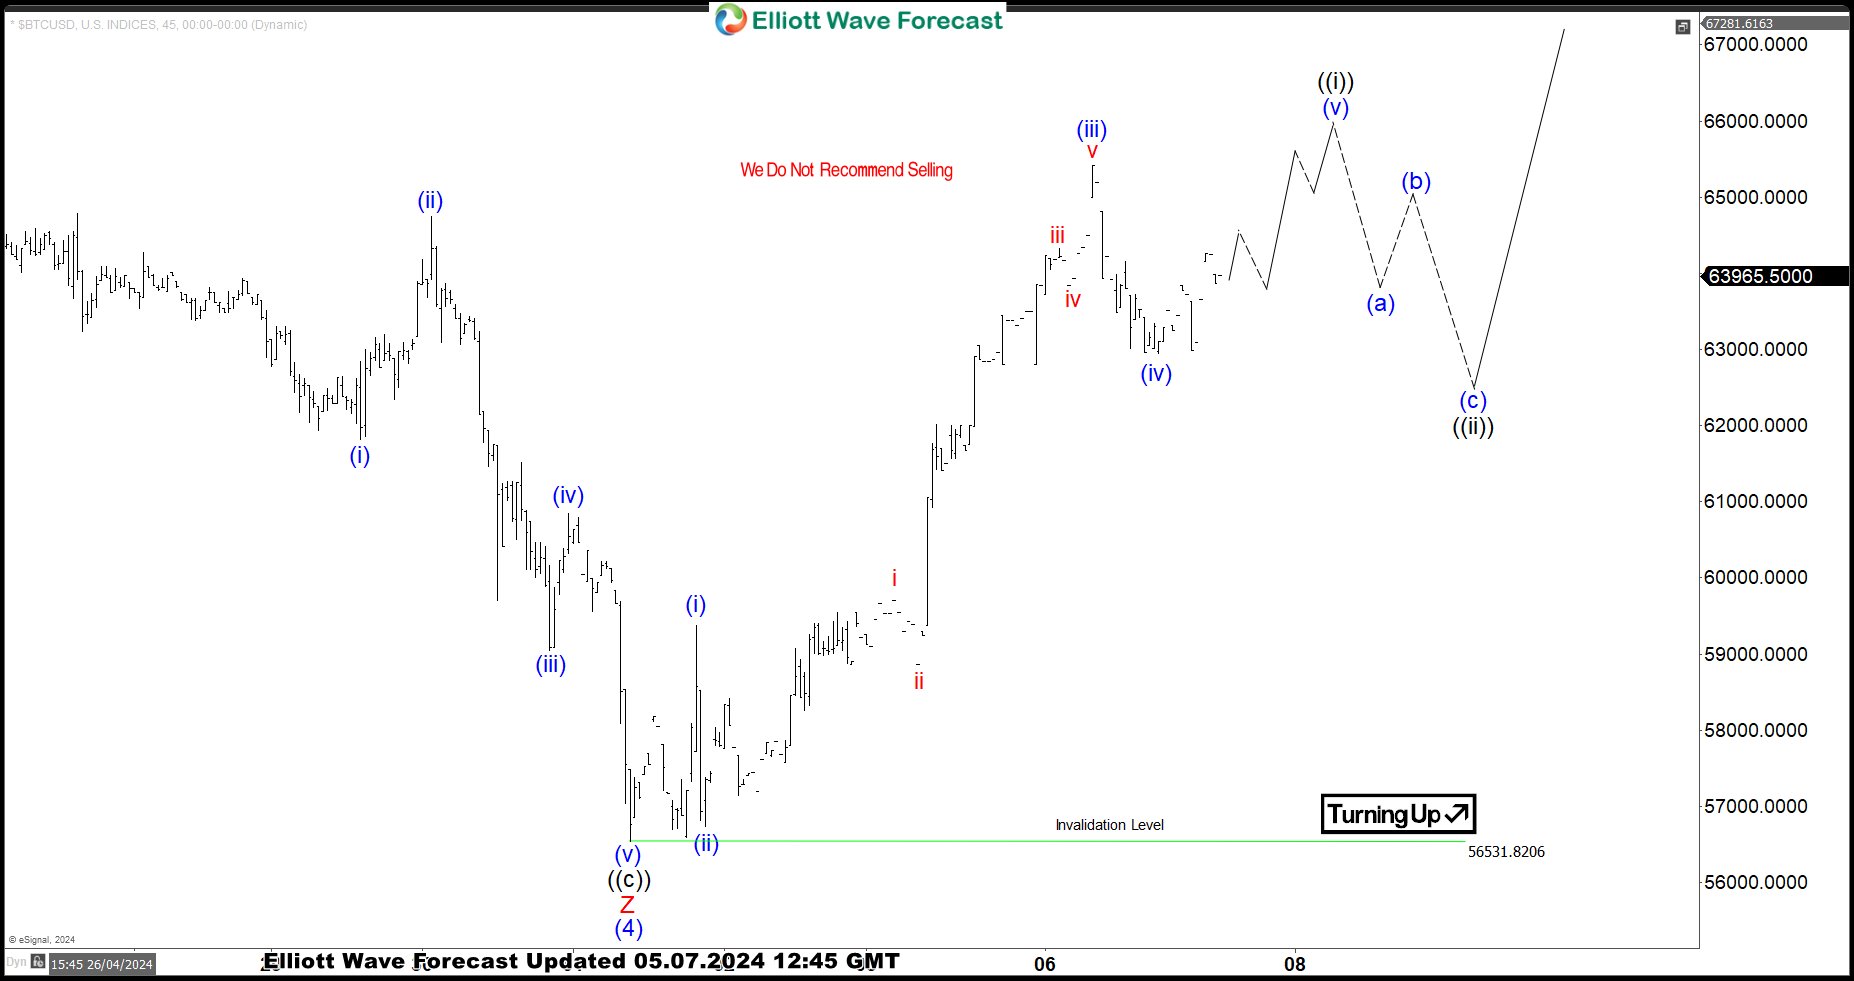
BTCUSD 1 Hour Elliott Wave Chart 7 May 2024
Bitcoin Short-term view suggests rally from May 1, 2024 is so far in 3 waves but it is extended and wave ( iii ) extended more than 261.8% Fibonacci extension of wave (i) related to wave (ii). This supports the idea that the rally should turn into an Elliott wave impulse. Once a new high has been seen, that will complete 5 waves up from the low and support the idea that pull backs should hold the low for at least 1 more leg higher.
면책 조항: 본 게시글에 표현된 견해는 전적으로 작성자의 견해이며 Followme의 공식 입장을 대변하지 않습니다. Followme는 제공된 정보의 정확성, 완전성 또는 신뢰성에 대해 책임을 지지 않으며, 서면으로 명시적으로 언급되지 않는 한 해당 내용을 기반으로 취해진 어떠한 조치에 대해서도 책임을 지지 않습니다.

