


· Views 110
면책 조항: 본 게시글에 표현된 견해는 전적으로 작성자의 견해이며 Followme의 공식 입장을 대변하지 않습니다. Followme는 제공된 정보의 정확성, 완전성 또는 신뢰성에 대해 책임을 지지 않으며, 서면으로 명시적으로 언급되지 않는 한 해당 내용을 기반으로 취해진 어떠한 조치에 대해서도 책임을 지지 않습니다.
이 글이 마음에 드시나요? 작성자에게 팁을 보내 감사의 마음을 전하세요.
| Scenario | |
|---|---|
| Timeframe | Intraday |
| Recommendation | BUY |
| Entry Point | 112.904 |
| Take Profit | 114.100 |
| Stop Loss | 112.494 |
| Key Levels | 112.300, 112.494, 114.100, 114.724 |
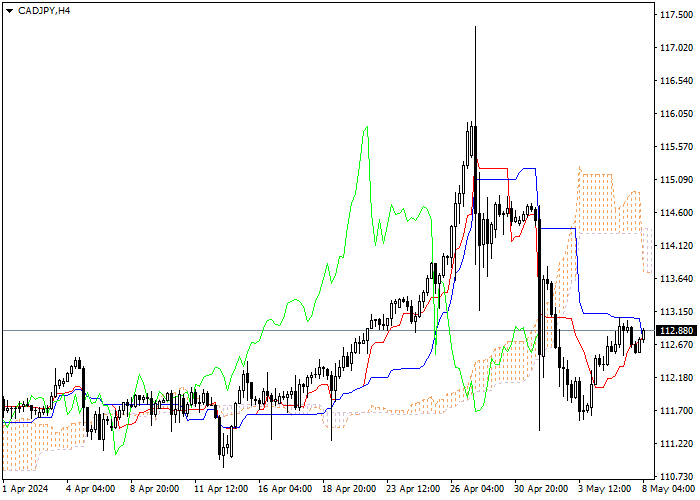
Let's look at the four-hour chart. Tenkan-sen line is crossing Kijun-sen from below, the blue line is directed downwards, while the red one remains horizontal. Confirmative line Chikou Span is approaching the price chart from below, current cloud is descending. The instrument is trading above Tenkan-sen and Kijun-sen lines; the Bullish trend is still strong. One of the previous minimums of Chikou Span line is expected to be a support level (112.494). The closest resistance level is the upper border of the cloud (114.100).
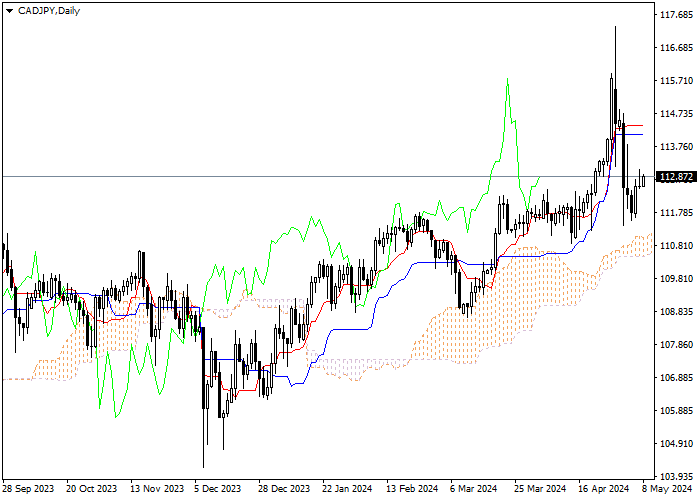
On the daily chart Tenkan-sen line is above Kijun-sen, the lines are horizontal . Confirmative line Chikou Span is above the price chart, current cloud is ascending. The instrument is trading below Tenkan-sen and Kijun-sen lines; the Bearish trend is still strong. The closest support level is the upper border of the cloud (112.300). One of the previous maximums of Chikou Span line is expected to be a resistance level (114.724).
It is recommended to open long positions at current price with Take Profit at the level of previous maximum of Chikou Span (114.100) line and Stop Loss at the level of Kijun-sen line (112.494).
면책 조항: 본 게시글에 표현된 견해는 전적으로 작성자의 견해이며 Followme의 공식 입장을 대변하지 않습니다. Followme는 제공된 정보의 정확성, 완전성 또는 신뢰성에 대해 책임을 지지 않으며, 서면으로 명시적으로 언급되지 않는 한 해당 내용을 기반으로 취해진 어떠한 조치에 대해서도 책임을 지지 않습니다.

