


Chevron Corporation (CVX) is a multinational energy corporation operating in all facets of the oil and gas industry. This includes exploration, production, refining, and marketing. Headquartered in San Ramon, California, Chevron has a global presence with operations spanning over 180 countries. This article looks at the long term Elliiot Wave outlook of the company.
Chevron Monthly Elliott Wave Chart
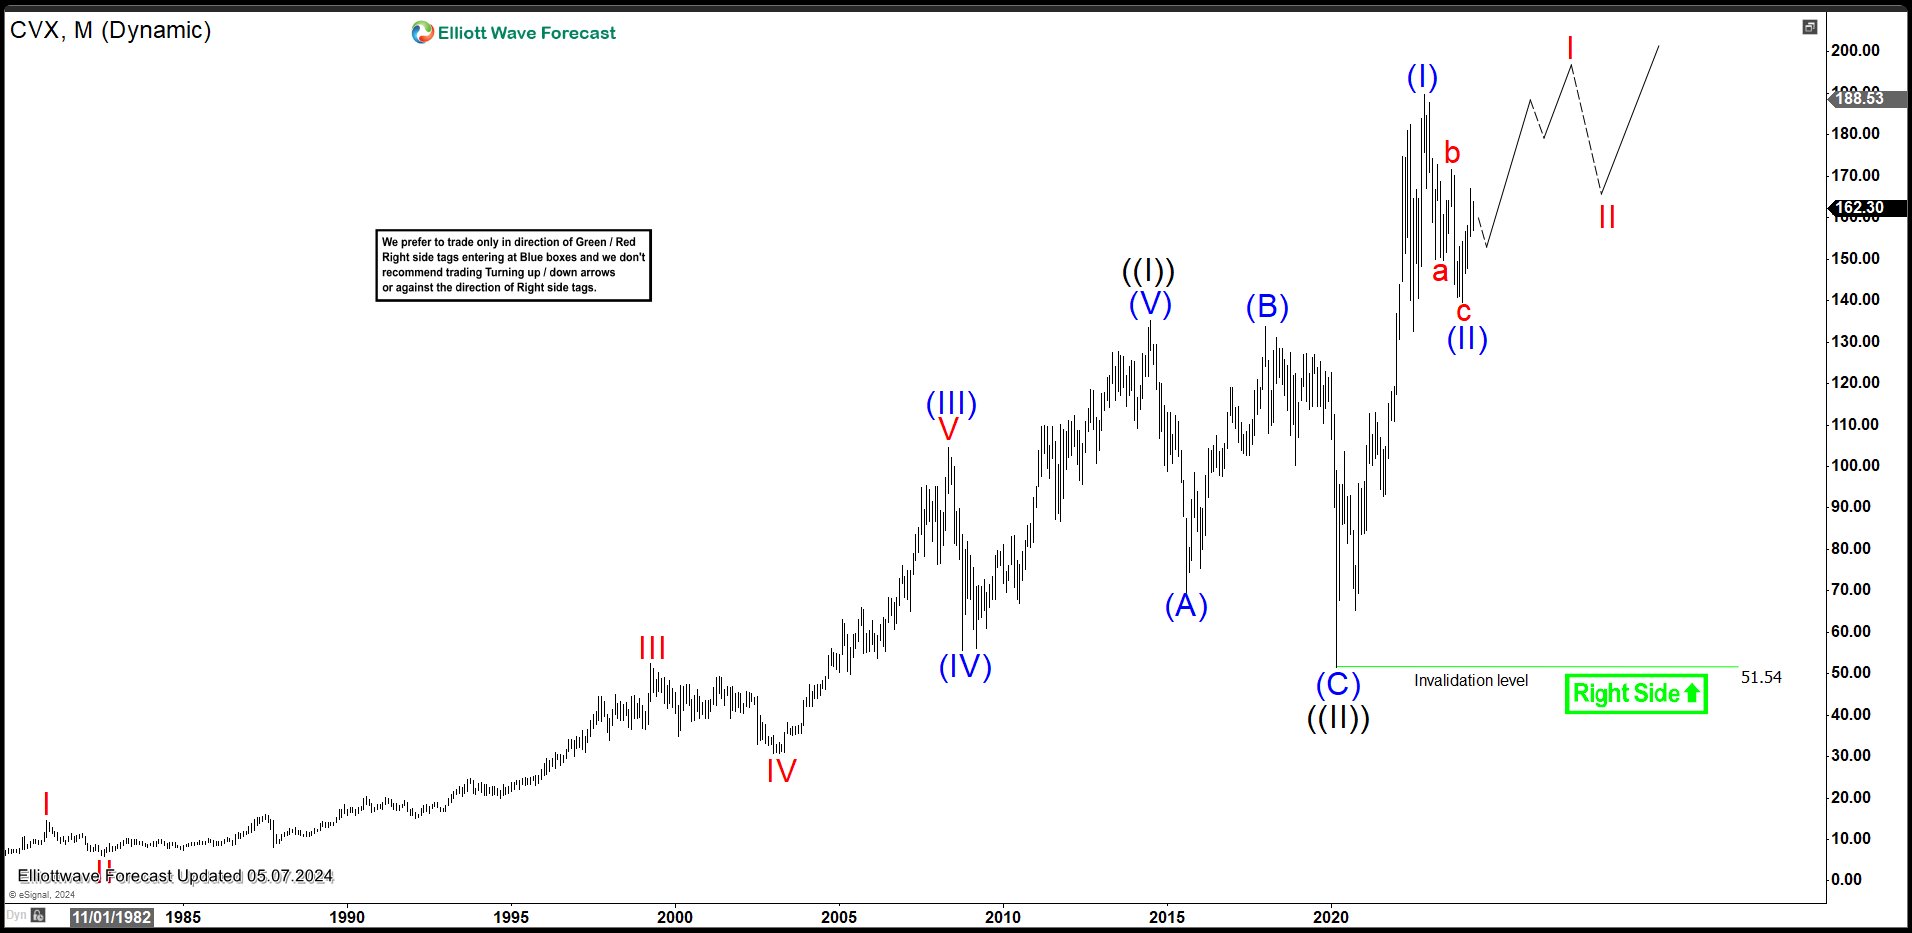
Monthly Elliott Wave Chart of Chevron (CVX) above shows rally to 135.1 ended wave ((I)). wave ((II)) pullback took the form of a zigzag Elliott Wave structure. Down from wave ((I)), wave (A) ended at 69.58. The stock then rallied in wave (B) towards 133.88. Wave (C) lower resumed lower towards 51.54 which completed wave ((II)) in higher degree. Wave ((III)) higher is currently in progress as an impulsive structure. Up from wave ((II)), wave (I) ended at 182.4. Pullback in wave (II) ended as a zigzag structure at 139.62 and the stock has resumed higher. As far as pivot at 51.54 low stays intact, expect the stock to extend higher.
Chevron Daily Elliott Wave Chart
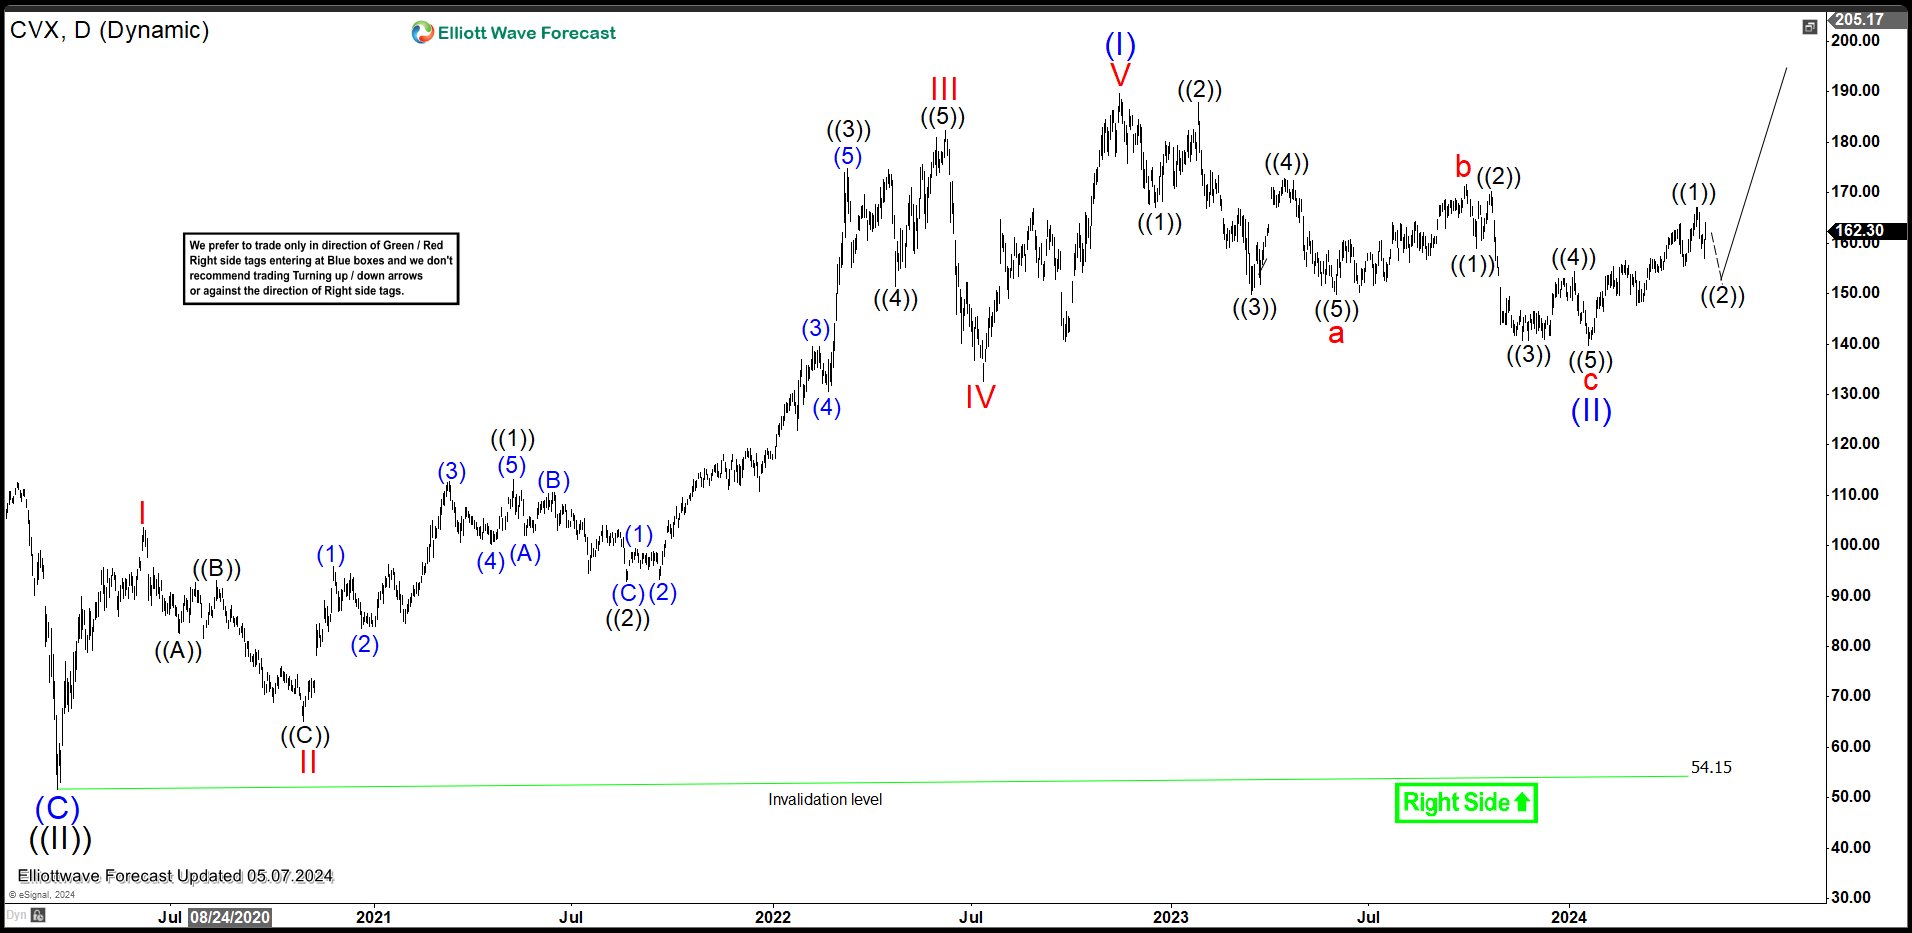
Daily Elliott Wave Chart for Chevron above shows that wave (I) rally ended at 182.4. Pullback in wave (II) has also ended at 139.62 and the stock has resumed higher. Up from wave (II), wave ((1)) ended at 167.11. Expect wave ((2)) pullback to stay above 139.62 for further upside. Near term, as far as pivot at 139.62 low and more importantly pivot at 54.15 low stays intact, expect the stock to extend higher.
면책 조항: 본 게시글에 표현된 견해는 전적으로 작성자의 견해이며 Followme의 공식 입장을 대변하지 않습니다. Followme는 제공된 정보의 정확성, 완전성 또는 신뢰성에 대해 책임을 지지 않으며, 서면으로 명시적으로 언급되지 않는 한 해당 내용을 기반으로 취해진 어떠한 조치에 대해서도 책임을 지지 않습니다.

