


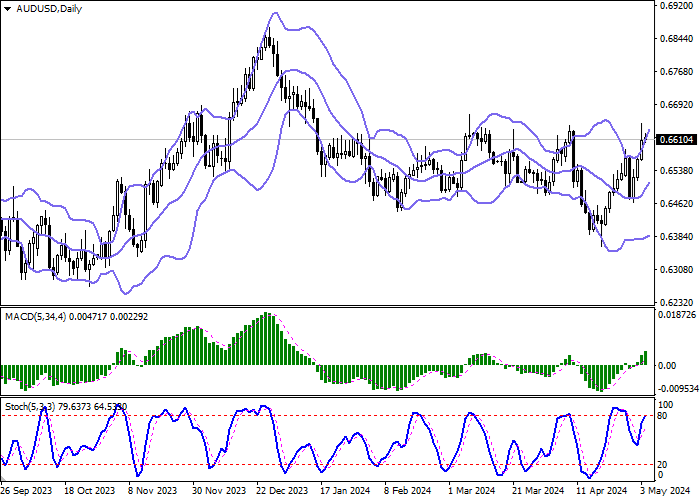
| Scenario | |
|---|---|
| Timeframe | Intraday |
| Recommendation | BUY STOP |
| Entry Point | 0.6625 |
| Take Profit | 0.6667 |
| Stop Loss | 0.6600 |
| Key Levels | 0.6540, 0.6558, 0.6578, 0.6600, 0.6623, 0.6646, 0.6667, 0.6700 |
| Alternative scenario | |
|---|---|
| Recommendation | SELL STOP |
| Entry Point | 0.6600 |
| Take Profit | 0.6558 |
| Stop Loss | 0.6623 |
| Key Levels | 0.6540, 0.6558, 0.6578, 0.6600, 0.6623, 0.6646, 0.6667, 0.6700 |
Current trend
The AUD/USD pair shows multidirectional trading dynamics, holding on in the area of 0.6617 and local highs of March 8, updated the day before. The pressure on the American currency last Friday was provided by April statistics on the US labor market.
Thus, the Nonfarm Payrolls decreased from 315.0 thousand to 175.0 thousand with expectations of 243.0 thousand, the Average Hourly Earnings slowed down from 0.3% to 0.2% in monthly terms and from 4.1% to 3.9% in annual terms, and the Unemployment Rate rose from 3.8% to 3.9%. Another negative factor was a sharp decrease in the US Services PMI from the Institute of Supply Management (ISM) in April from 51.4 points to 49.4 points, while analysts were counting on growth to 52.0 points. Meanwhile, a similar indicator in Australia from Commonwealth Bank dropped from 54.2 points to 53.6 points with neutral forecasts. Business activity is restored, although at a lower pace than experts expected, maintaining the risks of high prices in the country and reducing the likelihood of adjusting the monetary policy of the Reserve Bank of Australia (RBA) in the near future.
Today, investors are focused on Australian data on inflation from TD Securities: in April, the indicator was adjusted from 3.8% to 3.7% in annual terms, and in monthly terms it added 0.1%. Tomorrow at 6:30 (GMT 2) the results of the RBA meeting will be published: analysts do not imply any changes in the vector of the monetary policy of the regulator; however, updated forecasts and assessment will still be important.
Support and resistance
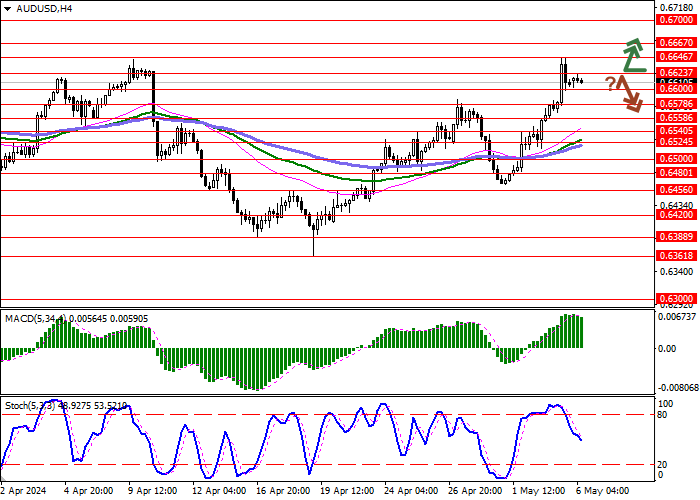
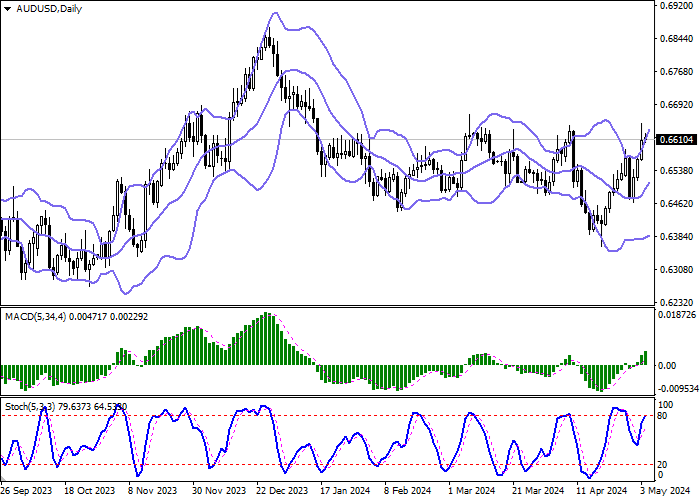
Bollinger Bands on the daily chart show a steady increase. The price range expands from above, freeing a path to new local highs for the "bulls". MACD grows, preserving a stable buy signal (located above the signal line). Stochastic shows similar dynamics but is rapidly approaching its highs, which reflects risks of the overbought Australian dollar in the ultra-short term.
Resistance levels: 0.6623, 0.6646, 0.6667, 0.6700.
Support levels: 0.6600, 0.6578, 0.6558, 0.6540.
Trading tips
Long positions can be opened after a breakout of 0.6623 with the target of 0.6667. Stop-loss — 0.6600. Implementation time: 1-2 days.
A rebound from 0.6623 as from resistance, followed by a breakdown of 0.6600 may become a signal for opening of new short positions with the target at 0.6558. Stop-loss — 0.6623.
면책 조항: 본 게시글에 표현된 견해는 전적으로 작성자의 견해이며 Followme의 공식 입장을 대변하지 않습니다. Followme는 제공된 정보의 정확성, 완전성 또는 신뢰성에 대해 책임을 지지 않으며, 서면으로 명시적으로 언급되지 않는 한 해당 내용을 기반으로 취해진 어떠한 조치에 대해서도 책임을 지지 않습니다.

