


| Scenario | |
|---|---|
| Timeframe | Weekly |
| Recommendation | BUY STOP |
| Entry Point | 5120.0 |
| Take Profit | 5220.0 |
| Stop Loss | 5080.0 |
| Key Levels | 4930.0, 5030.0, 5120.0, 5220.0 |
| Alternative scenario | |
|---|---|
| Recommendation | SELL STOP |
| Entry Point | 5030.0 |
| Take Profit | 4930.0 |
| Stop Loss | 5080.0 |
| Key Levels | 4930.0, 5030.0, 5120.0, 5220.0 |
Current trend
Quotes of the S&P 500 index are adjusted at around 5078.0 against the backdrop of mixed corporate reporting.
Tech giant Apple Inc. reported revenue of 90.80 billion dollars, which beat the 90.32 billion dollars analysts had expected but was below last year's 94.80 billion dollars. Earnings per share rose to 1.53 dollars from 1.52 dollars previously, with a forecast of 1.50 dollars.
Biopharmaceutical company Amgen Inc. showed revenue of 7.45 billion dollars, which matched analysts' forecasts and exceeded 6.10 billion dollars in the same period a year earlier, and earnings per share amounted to 3.96 dollars, which was lower than 3.98 dollars recorded in the previous quarter but exceeded the 3.89 dollars expected by experts.
Revenue from travel company Booking Holdings Inc. rose to 4.40 billion dollars from 3.80 billion dollars in the same period a year earlier, with expectations of 4.25 billion dollars, and earnings per share increased to 20.39 dollars from 11.60 dollars last year, while analysts were expecting 14.09 dollars.
The growth leaders in the index are Howmet Aerospace Inc. ( 15.44%), Paramount Global Class B ( 13.05%), Moderna Inc. ( 12.68%), CH Robinson Worldwide Inc. ( 12.26%).
Among the leaders of the decline are Etsy Inc. (-15.06%), Qorvo Inc. (-14.50%), Huntington Ingalls Industries Inc. (-11.50%).
Support and resistance
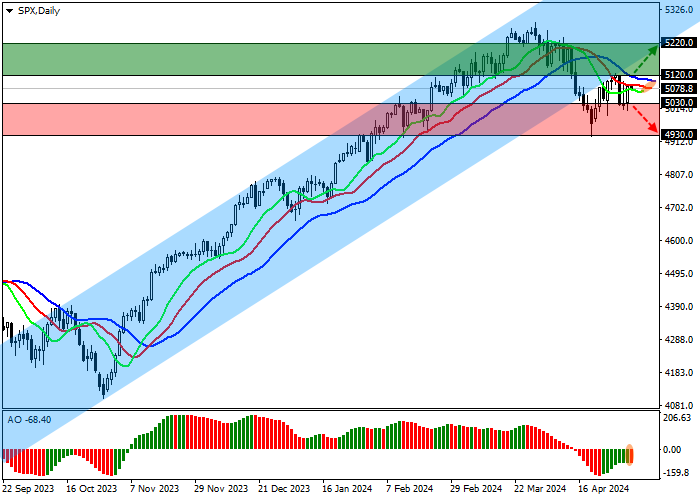
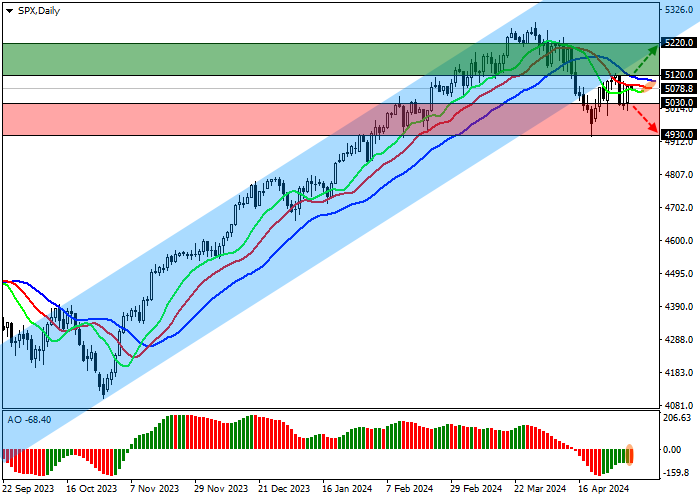
Index quotes continue to grow, moving towards the support line of the recently abandoned ascending channel 5400.0–5100.0 on the daily chart.
Technical indicators are holding a sell signal, which is actively slowing down: fast EMAs on the Alligator indicator are approaching the signal line, and the AO histogram is forming upward bars being in the sale zone.
Support levels: 5030.0, 4930.0.
Resistance levels: 5120.0, 5220.0.
Trading tips
If the asset continues to grow, and the price consolidates above the resistance level of 5120.0, buy positions with a target of 5220.0 will be relevant. Stop-loss — 5080.0. Implementation time: 7 days and more.
If the asset reverses and declines and the price consolidates below 5030.0, short positions can be opened with the target at 4930.0. Stop-loss — 5080.0.
면책 조항: 본 게시글에 표현된 견해는 전적으로 작성자의 견해이며 Followme의 공식 입장을 대변하지 않습니다. Followme는 제공된 정보의 정확성, 완전성 또는 신뢰성에 대해 책임을 지지 않으며, 서면으로 명시적으로 언급되지 않는 한 해당 내용을 기반으로 취해진 어떠한 조치에 대해서도 책임을 지지 않습니다.

