


| Scenario | |
|---|---|
| Timeframe | Weekly |
| Recommendation | BUY STOP |
| Entry Point | 0.6600 |
| Take Profit | 0.6680 |
| Stop Loss | 0.6550 |
| Key Levels | 0.6440, 0.6540, 0.6600, 0.6680 |
| Alternative scenario | |
|---|---|
| Recommendation | SELL STOP |
| Entry Point | 0.6540 |
| Take Profit | 0.6440 |
| Stop Loss | 0.6600 |
| Key Levels | 0.6440, 0.6540, 0.6600, 0.6680 |
Current trend
Against a weakening American dollar and macroeconomic statistics from Australia, the AUD/USD pair is correcting at 0.6574.
In March, exports increased by 0.1% from –3.2% previously, and imports by 4.2%, leading to a correction in the trade balance from 6.591B Australian dollars to 5.024B Australian dollars instead of an expected increase of 7.190B Australian dollars. Today’s data reflected the recovery of the poorest sector of the national economy, the construction market: in April, the volume of investment in real estate rose from 1.2% to 3.8%, and the number of issued housing loans – from 1.6% to 2.8%, exceeding analysts’ forecasts 1.0%. The volume of construction permits adjusted by 1.9% MoM, less than the predicted 3.5%, and by –2.5% compared to preliminary estimates of 5.2% YoY. The market remains under pressure from the high interest rates of the Reserve Bank of Australia (RBA) and is still far from last year’s levels.
The American dollar is trading at 105.1 points in USDX. Investors practically did not react to initial jobless claims data, which remained at 208.0K this week, the total claims reached 1.774M, and the average number of claims over four weeks decreased from 213.5K to 210.0K. The Q1 nonfarm productivity increased by 0.3% compared to an increase of 3.5% earlier.
Support and resistance
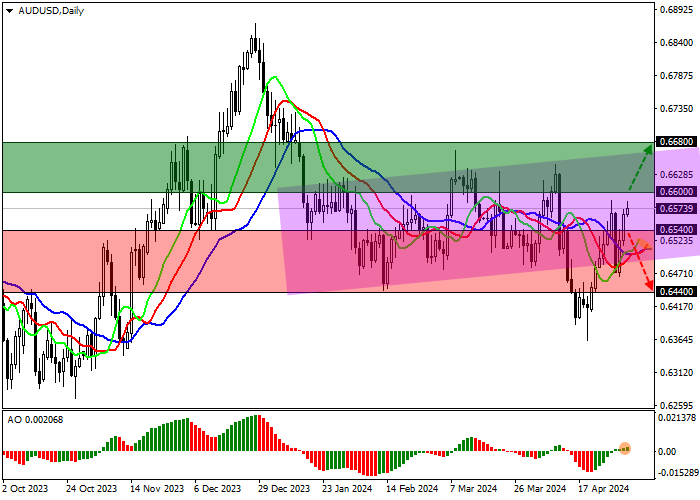
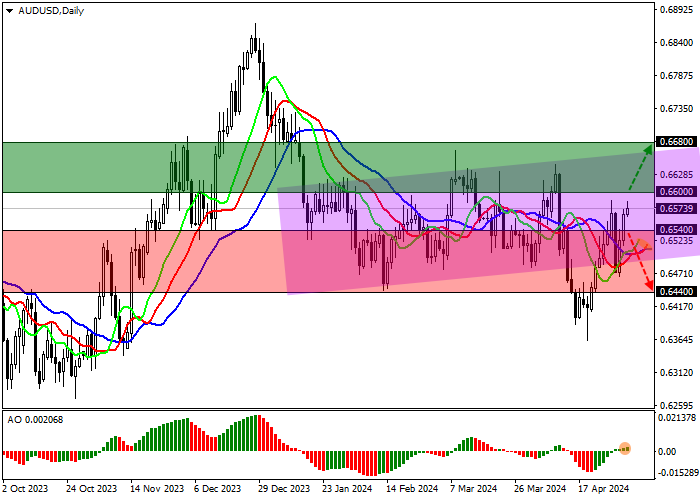
On the daily chart, the trading instrument is rising, approaching the resistance line of the ascending channel with dynamic boundaries of 0.6700–0.6500.
Technical indicators gave a buy signal: fast EMA on the Alligator indicator crossed the signal line upward and began to expand the range of fluctuations, and the AO histogram is growing in the positive zone.
Support levels: 0.6540, 0.6440.
Resistance levels: 0.6600, 0.6680.
Trading tips
Long positions may be opened after the price rises and consolidates above 0.6600, with the target at 0.6680. Stop loss – 0.6550. Implementation period: 7 days or more.
Short positions may be opened after the price declines and consolidates below 0.6540, with the target at 0.6440. Stop loss – 0.6600.
면책 조항: 본 게시글에 표현된 견해는 전적으로 작성자의 견해이며 Followme의 공식 입장을 대변하지 않습니다. Followme는 제공된 정보의 정확성, 완전성 또는 신뢰성에 대해 책임을 지지 않으며, 서면으로 명시적으로 언급되지 않는 한 해당 내용을 기반으로 취해진 어떠한 조치에 대해서도 책임을 지지 않습니다.

