


| Scenario | |
|---|---|
| Timeframe | Intraday |
| Recommendation | SELL STOP |
| Entry Point | 152.00 |
| Take Profit | 150.00 |
| Stop Loss | 153.00 |
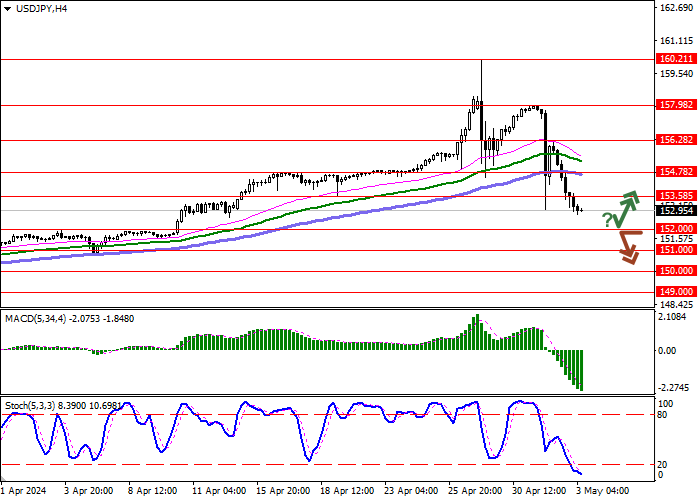
| Key Levels | 149.00, 150.00, 151.00, 152.00, 153.58, 154.78, 156.28, 157.98 |
| Alternative scenario | |
|---|---|
| Recommendation | BUY STOP |
| Entry Point | 153.60 |
| Take Profit | 156.28 |
| Stop Loss | 152.00 |
| Key Levels | 149.00, 150.00, 151.00, 152.00, 153.58, 154.78, 156.28, 157.98 |
Current trend
The USD/JPY pair is showing a fairly noticeable decline, extending the "bearish" momentum formed at the beginning of the week, when the instrument retreated from record highs located just above 160.00. The focus of investors' attention is on possible currency interventions by the Japanese monetary authorities, who have previously repeatedly warned the markets of their readiness to intervene in the situation. However, so far there has been no official confirmation of the measures taken. The Bank of Japan is believed to have spending funds of 1.15 trillion dollars, which will allow for up to ten more such transactions, but their effectiveness is difficult to predict as current monetary conditions remain negative for the national currency.
Macroeconomic statistics from Japan published this week did not provide any noticeable support to the yen. On Tuesday, April 30, March data on Retail Sales were presented: annual dynamics showed a sharp slowdown from 4.7% to 1.2% in annual terms, with a forecast of 2.5%, and in monthly terms the figure decreased by 1.2% after rising 1.5% in the previous month, while analysts had expected an increase of 0.6%. In turn, Industrial Production lost 6.7% after -3.9% a month earlier, with expectations at -6.6%.
Today in the USA at 14:30 (GMT 2) April statistics on the labor market will be published: it is expected that Nonfarm Payrolls will slow down from 303.0 thousand to 243.0 thousand, as well as Average Hourly Earnings may decline from 4.1% to 4.0%. Meanwhile, Initial Jobless Claims amounted to 208.0 thousand against the forecast of 212.0 thousand, and Continuing Jobless Claims remained at 1.774 million instead of the expected increase to 1.800 million, reflecting the stability of the labor market.
Support and resistance
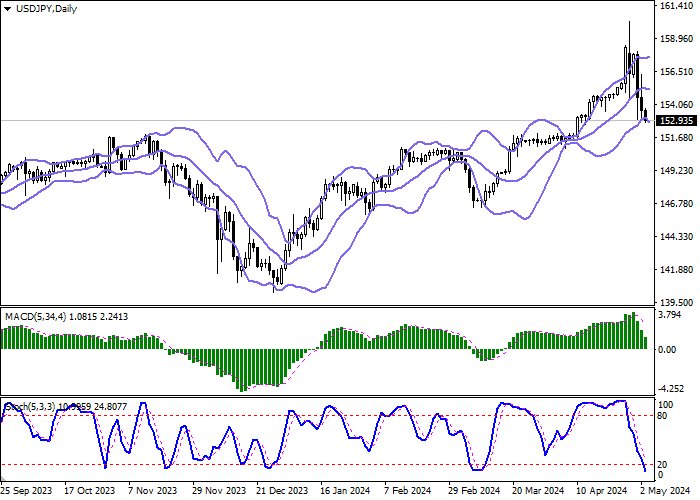
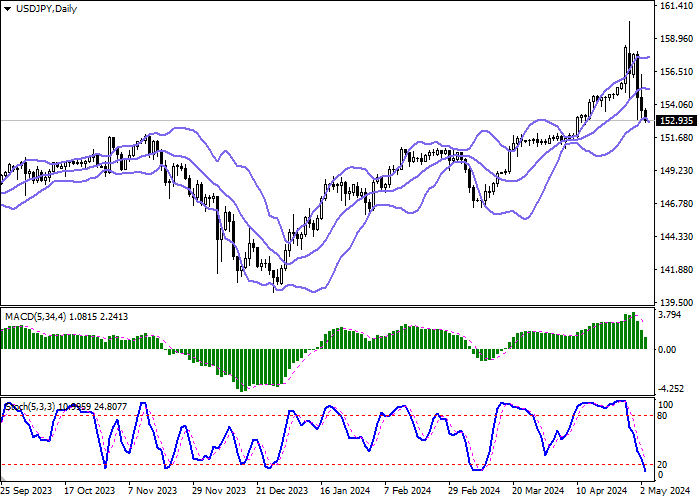
On the D1 chart Bollinger Bands are trying to reverse into the descending plane. The price range expands from below, making way for new local lows for the "bears". MACD is going down preserving a stable sell signal (located below the signal line). Stochastic shows similar dynamics, but is quickly approaching its lows, signaling the risks of the US currency being oversold in the ultra-short term.
Resistance levels: 153.58, 154.78, 156.28, 157.98.
Support levels: 152.00, 151.00, 150.00, 149.00.
Trading tips
Short positions may be opened after a breakdown of 152.00 with the target at 150.00. Stop-loss — 153.00. Implementation time: 1-2 days.
A rebound from 152.00 as from support followed by a breakout of 153.58 may become a signal for opening new long positions with the target at 156.28. Stop-loss — 152.00.
면책 조항: 본 게시글에 표현된 견해는 전적으로 작성자의 견해이며 Followme의 공식 입장을 대변하지 않습니다. Followme는 제공된 정보의 정확성, 완전성 또는 신뢰성에 대해 책임을 지지 않으며, 서면으로 명시적으로 언급되지 않는 한 해당 내용을 기반으로 취해진 어떠한 조치에 대해서도 책임을 지지 않습니다.

