


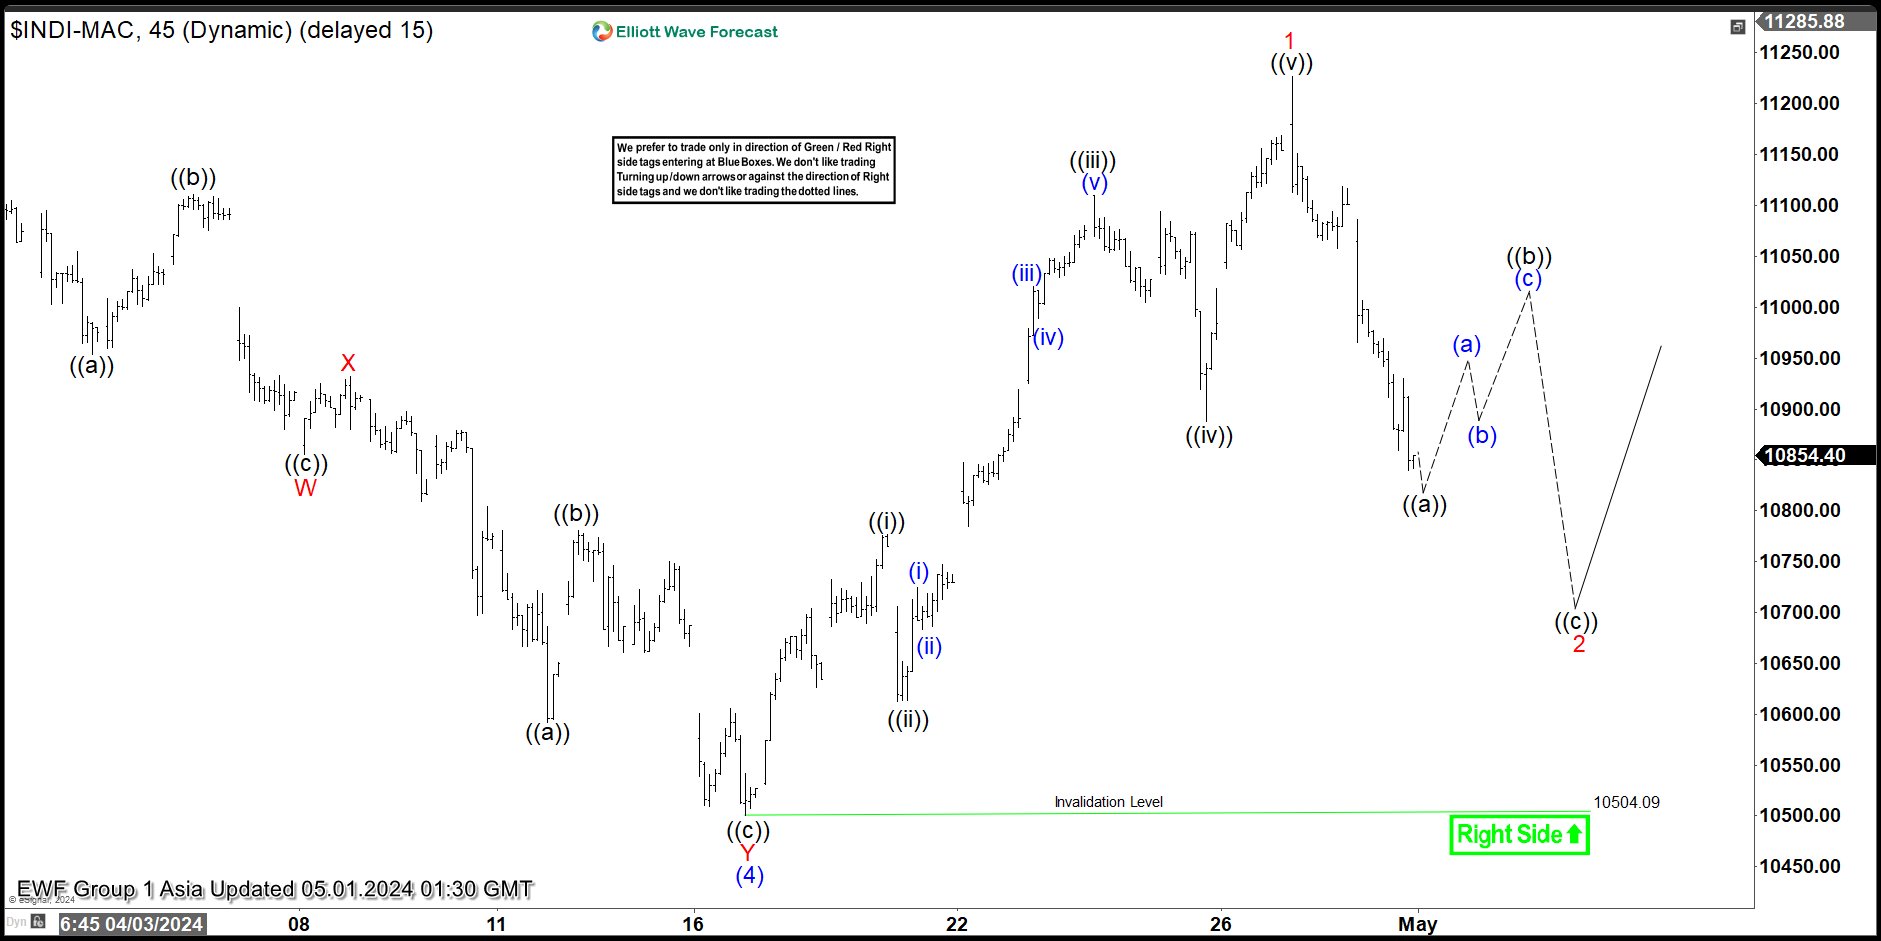
Short Term Elliott Wave View on IBEX suggests rally from 10.25.2023 low is in progress as a 5 waves impulse. Up from 10.25.2023 low, wave (1) ended at 10301.2 and pullback in wave (2) ended at 9798.80. The stock extended higher again in wave (3) towards 11139.9. Down from there, wave (4) unfolded as a double three Elliott Wave structure. Wave W ended at 10855.4 and wave X ended at 10932.20. Final leg wave Y ended at 10504.09 and this completed wave (4) in higher degree.
The Index has turned higher in wave (5). Up from wave (4), wave ((i)) ended at 10776.2 and pullback in wave ((ii)) ended at 10612.2. Index extended higher in wave ((iii)) towards 11110 and dips in wave ((iv)) ended at 10887.70. Final leg wave ((v)) ended at 11227 which completed wave 1 in higher degree. Pullback in wave 2 is now in progress to correct cycle from 4.16.2024 low before it resumes higher. Down from wave 1, wave ((a)) is expected to complete soon, then it should rally in wave ((b)). Afterwards, expect another leg down in wave ((c)) to complete wave 2 before Index resumes higher. Near term, as far as pivot at 10504.09 low stays intact, expect dips to find support in 3, 7, 11 swing for further upside.
IBEX 45 Minutes Elliott Wave Chart
면책 조항: 본 게시글에 표현된 견해는 전적으로 작성자의 견해이며 Followme의 공식 입장을 대변하지 않습니다. Followme는 제공된 정보의 정확성, 완전성 또는 신뢰성에 대해 책임을 지지 않으며, 서면으로 명시적으로 언급되지 않는 한 해당 내용을 기반으로 취해진 어떠한 조치에 대해서도 책임을 지지 않습니다.

