


| Scenario | |
|---|---|
| Timeframe | Weekly |
| Recommendation | SELL STOP |
| Entry Point | 84.70 |
| Take Profit | 81.50 |
| Stop Loss | 86.00 |
| Key Levels | 81.50, 84.70, 86.50, 89.50 |
| Alternative scenario | |
|---|---|
| Recommendation | BUY STOP |
| Entry Point | 86.50 |
| Take Profit | 89.50 |
| Stop Loss | 85.50 |
| Key Levels | 81.50, 84.70, 86.50, 89.50 |
Current trend
Prices for benchmark Brent Crude Oil are trading at 85.00.
Macroeconomic statistics from China support the quotes: in the first quarter, the country increased crude oil imports by 0.7% compared to the same period a year earlier, when the figure was 137.36M tons. In addition, during this period, production in China increased by 2.3% to 53.48M tons. Thus, the forecast of a significant decrease in energy demand from China in the first quarter did not come true, which had a positive impact on the market.
However, the local trend is under pressure due to the increase in strategic oil reserves in the United States. Thus, according to the American Petroleum Institute (API), oil reserves increased by 4.906M barrels over the week after decreasing by 3.230M barrels earlier, although experts expected a decrease of 1.500M. Today, a report from the Energy Information Administration of the US Department of Energy may be published (EIA): experts expect the value to change by –2.300M barrels after –6.368M barrels earlier, which raises doubts against API statistics.
The decline in quotations is also confirmed by the dynamics of investors’ demand for oil contracts, as traders have significantly reduced their market activity. According to the Chicago Mercantile Exchange (CME Group), yesterday, trading volume amounted to 789.689K transactions, which is inferior to the 1.253M contracts recorded on April 19, while on Monday, the figure reached the month’s low of 535.526K transactions.
Support and resistance
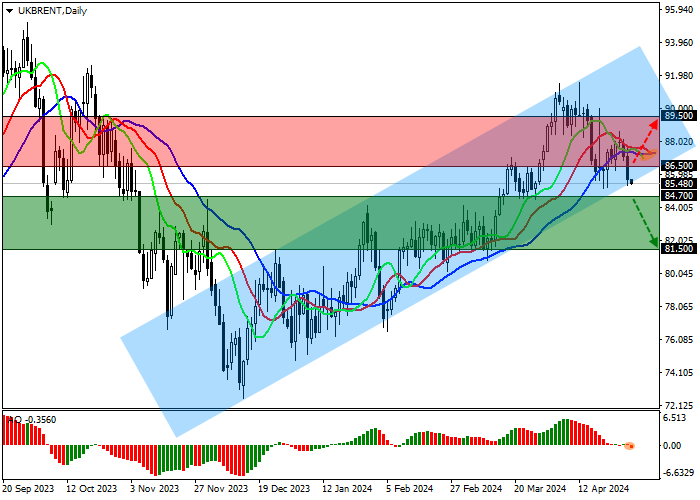
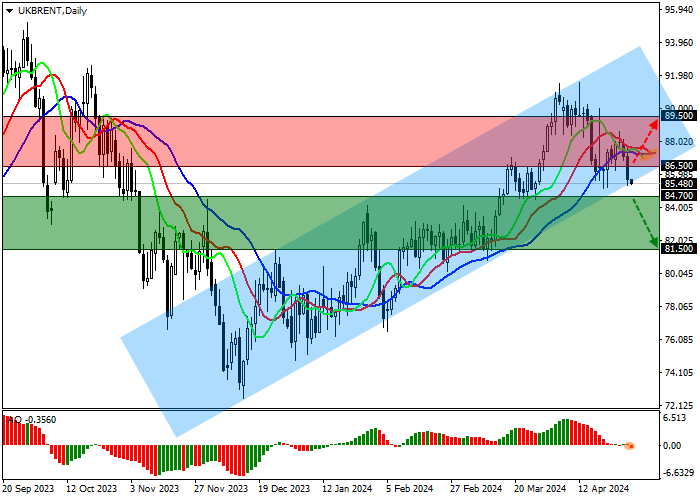
On the daily chart, the trading instrument is moving in a corrective trend, trying to consolidate below the support line of the ascending corridor 92.00–85.50.
Technical indicators gave a sell signal: fast EMA of the Alligator indicator crossed the signal line downwards, and the AO histogram is forming corrective bars in the sales zone.
Resistance levels: 86.50, 89.50.
Support levels: 84.70, 81.50.
Trading tips
Short positions may be opened after the price declines and consolidates below 84.70, with the target at 81.50. Stop loss – 86.00. Implementation period: 7 days or more.
Long positions may be opened after the price rises and consolidates above 86.50, with the target at 89.50. Stop loss – 85.50.
면책 조항: 본 게시글에 표현된 견해는 전적으로 작성자의 견해이며 Followme의 공식 입장을 대변하지 않습니다. Followme는 제공된 정보의 정확성, 완전성 또는 신뢰성에 대해 책임을 지지 않으며, 서면으로 명시적으로 언급되지 않는 한 해당 내용을 기반으로 취해진 어떠한 조치에 대해서도 책임을 지지 않습니다.

