


| Scenario | |
|---|---|
| Timeframe | Weekly |
| Recommendation | SELL STOP |
| Entry Point | 37100.0 |
| Take Profit | 35500.0 |
| Stop Loss | 38000.0 |
| Key Levels | 35500.0, 37100.0, 38100.0, 39700.0 |
| Alternative scenario | |
|---|---|
| Recommendation | BUY STOP |
| Entry Point | 38100.0 |
| Take Profit | 39700.0 |
| Stop Loss | 37500.0 |
| Key Levels | 35500.0, 37100.0, 38100.0, 39700.0 |
Current trend
The corporate reporting period started last week: so far, leading Japanese companies have recorded mostly negative results, which is the main reason for the decline in the stock market and, in particular, the NI 225 index, which is held around 37540.0.
Tomorrow, statistics from the pharmaceutical company Chugai Pharmaceutical Co. will be presented, whose revenue is likely to drop to 254.86 billion yen from 273.81 billion yen a quarter earlier, and earnings per share (EPS) to 47.51 yen from 55.43 yen. Digital equipment manufacturer Canon Inc. is also preparing to show results, which are likely to be weak: revenue is expected to reach 1.017 trillion yen after 1.163 trillion yen in the previous quarter, and EPS may decrease from 81.56 yen to 64.1 yen. Robotics company Fanuc Corp. is likely to record revenue of 191.57 billion yen, down from 197.83 billion yen a quarter earlier, and EPS are forecast at 34.85 yen after 36.33 yen.
The increase in the interest rate in Japan continues to support the bond market, which has been growing since the beginning of the month: 10-year securities are holding at a yield of 0.879%, which is higher than a week earlier at 0.833%, 20-year bonds are trading at a rate of 1.660%, exceeding the 1.600% recorded last week, and a yield of 30-summer securities increased from 1.882% to 1.935%.
The growth leaders in the index are Osaka Gas Co., Ltd. ( 6.09%), NTT Data Corp. ( 3.28%), Tokyo Gas Co., Ltd. ( 2.76%), Kajima Corp. ( 2.30%).
Among the leaders of the decline are Toho Co., Ltd (-2.33%), Kansai Electric Power Co., Inc. (-2.04%), Yamaha Corp. (-2.00%).
Support and resistance
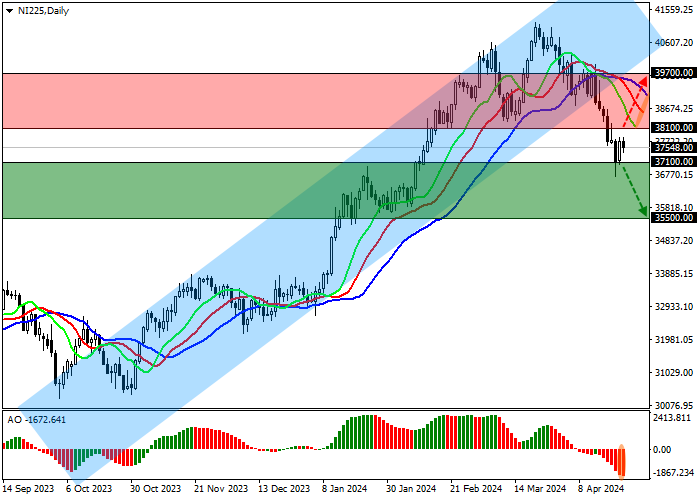
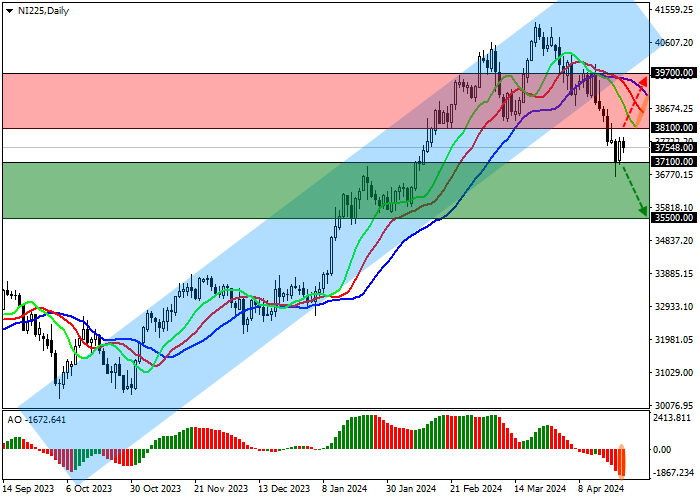
On the D1 chart, the price moves away from the support line of the ascending channel 40600.0–38800.0.
The technical indicators have completely reversed around and issued a new sell signal: the AO histogram forms new descending bars, and fast EMAs on the Alligator indicator move away from the signal line, expanding the range of fluctuations.
Support levels: 37100.0, 35500.0.
Resistance levels: 38100.0, 39700.0.
Trading tips
In the event of a reversal and the continued decline of the asset, as well as price consolidation below the support level of 37100.0, sell positions with the target of 35500.0 can be opened. Stop-loss – 38000.0. Implementation time: 7 days and more.
In case of continued growth of the asset, as well as consolidation above the resistance level of 38100.0, buy positions with the target of 39700.0 may be opened. Stop-loss – 37500.0.
면책 조항: 본 게시글에 표현된 견해는 전적으로 작성자의 견해이며 Followme의 공식 입장을 대변하지 않습니다. Followme는 제공된 정보의 정확성, 완전성 또는 신뢰성에 대해 책임을 지지 않으며, 서면으로 명시적으로 언급되지 않는 한 해당 내용을 기반으로 취해진 어떠한 조치에 대해서도 책임을 지지 않습니다.

