


| Scenario | |
|---|---|
| Timeframe | Intraday |
| Recommendation | BUY STOP |
| Entry Point | 1.3800 |
| Take Profit | 1.3900 |
| Stop Loss | 1.3750 |
| Key Levels | 1.3616, 1.3650, 1.3700, 1.3750, 1.3800, 1.3853, 1.3900, 1.3950 |
| Alternative scenario | |
|---|---|
| Recommendation | SELL STOP |
| Entry Point | 1.3750 |
| Take Profit | 1.3650 |
| Stop Loss | 1.3800 |
| Key Levels | 1.3616, 1.3650, 1.3700, 1.3750, 1.3800, 1.3853, 1.3900, 1.3950 |
Current trend
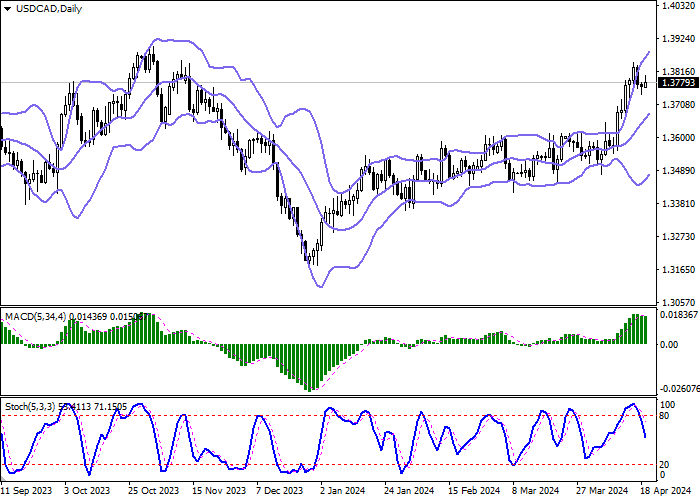
The USD/CAD pair is showing weak growth, recovering from a two-day decline, as a result of which the instrument managed to retreat from the local highs of November 10, 2023. Quotes are testing 1.3780 for a breakout, while the publication of macroeconomic statistics from the USA or Canada at the end of the week is not scheduled.
Data from the US presented the day before did not provide significant support for the American currency. However, the Philadelphia Fed Manufacturing Survey in April increased from 3.2 points to 15.5 points, with a forecast of 1.5 points, and Initial Jobless Claims for the week ended 12 April remained at the same level of 212.0 thousand, while analysts expected 215.0 thousand.
In turn, the American currency is supported by expectations that the US Federal Reserve will not reduce the interest rate in the near future, which, against the backdrop of easing monetary policies by other global central banks, will make the US dollar even more attractive to investors. At the same time, the American regulator is still announcing an adjustment to the cost of borrowing this year, without naming specific deadlines. The main scenario assumes the first decline in the indicator in September, and in total, by the end of 2024, no more than two changes in the rate are currently expected, whereas two or three ones were previously predicted.
At the beginning of the week, inflation statistics were published in Canada: in March, the Consumer Price Index increased from 0.3% to 0.6%, while experts expected 0.7%, and in annual terms the dynamics accelerated from 2.8% to 2.9%. The Core CPI from the Bank of Canada increased from 0.1% to 0.5% on a monthly basis and slowed down from 2.1% to 2.0% on an annual basis.
Support and resistance
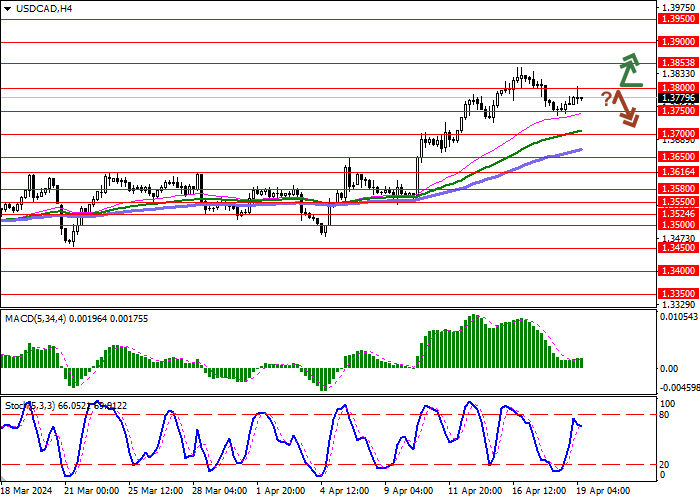
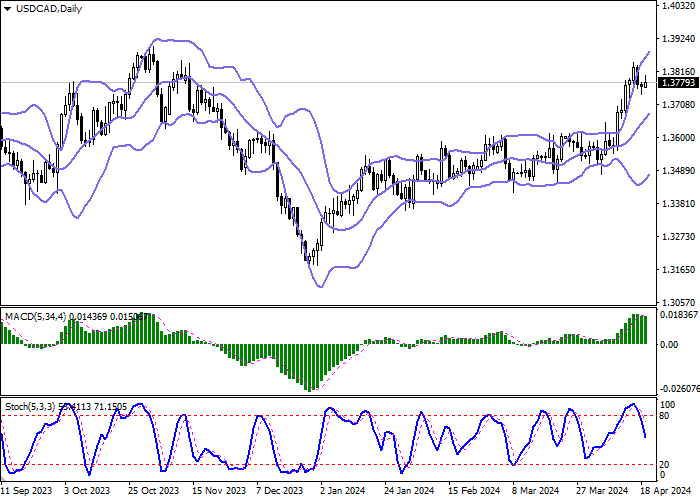
Bollinger Bands on the daily chart show a steady increase. The price range expands, freeing a path to new local highs for the "bulls". MACD reversed downwards having formed a new sell signal (located below the signal line). Stochastic is showing a more active decline and is currently located approximately in the center of its area, signaling in favor of the development of a "bearish" correction in the ultra-short term.
Resistance levels: 1.3800, 1.3853, 1.3900, 1.3950.
Support levels: 1.3750, 1.3700, 1.3650, 1.3616.
면책 조항: 본 게시글에 표현된 견해는 전적으로 작성자의 견해이며 Followme의 공식 입장을 대변하지 않습니다. Followme는 제공된 정보의 정확성, 완전성 또는 신뢰성에 대해 책임을 지지 않으며, 서면으로 명시적으로 언급되지 않는 한 해당 내용을 기반으로 취해진 어떠한 조치에 대해서도 책임을 지지 않습니다.

