


| Scenario | |
|---|---|
| Timeframe | Weekly |
| Recommendation | SELL STOP |
| Entry Point | 0.4660 |
| Take Profit | 0.3906, 0.3418 |
| Stop Loss | 0.5200 |
| Key Levels | 0.3418, 0.3906, 0.4700, 0.5650, 0.6348, 0.6836, 0.7324 |
| Alternative scenario | |
|---|---|
| Recommendation | BUY STOP |
| Entry Point | 0.5700 |
| Take Profit | 0.6348, 0.6836, 0.7324 |
| Stop Loss | 0.5300 |
| Key Levels | 0.3418, 0.3906, 0.4700, 0.5650, 0.6348, 0.6836, 0.7324 |
Current trend
Yesterday, WTI Crude Oil lost 3.0% in value amid macroeconomic statistics and investor concerns about energy demand in 2024.
Thus, oil reserves over the past week increased by 2.735M barrels, the forecast was 1.600M. According to an analysis conducted by experts at JPMorgan Chase & Co., global oil consumption in April was 200.0K barrels per day lower than the previous forecast, amounting to an average of 101.0M barrels per day. Since the beginning of the year, the figure has increased by 1.7M barrels per day, below the November forecast of 2.0M barrels per day.
The correction in the silver contract market continues. According to the US Commodity Futures Trading Commission (CFTC), last week, net speculative positions in WTI Crude Oil decreased from 300.9K to 297.1K. As for the dynamics, there is a noticeable local reduction in positions in both categories, which reflects a temporary decrease in demand. Thus, the balance of the “bulls” among the producers amounted to 321.323K against 325.358K for the “bears.” Last week, buyers opened 8.884K fewer contracts, while sellers opened 6.379K fewer, which reflects the formation of a correction and fixation of some positions.
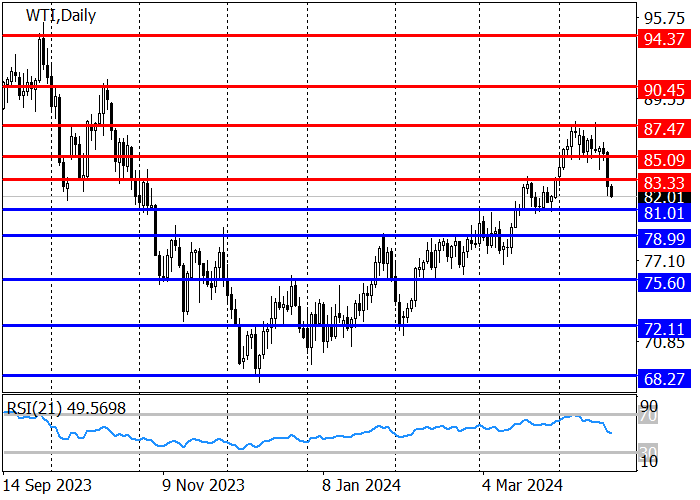
Against this background, the downward correction continues, and the price has overcome the support level of 83.33, heading to 81.00, after breaking through which it may reach 79.00, and if it holds, the price will rise to 85.10. The RSI (21) indicator reflected an upcoming correction and is now in the neutral zone, allowing traders to consider both long and short positions.
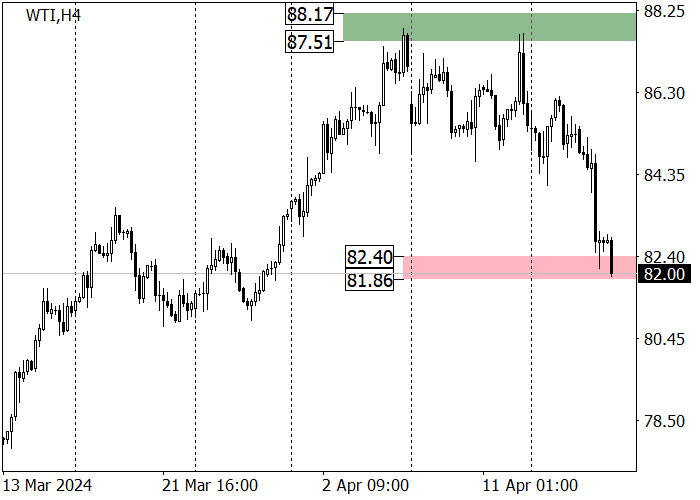
The medium-term trend remains upward: after reaching zone 3 (88.17–87.51), a downward correction began, within which the asset reached the key trend support 82.40–81.86, from which long positions with the target in zone 3 are relevant. If sellers consolidate below the key support, the trend will reverse downwards towards zone 2 (76.99–76.45).
Support and resistance
Resistance levels: 83.33, 85.09, 87.47.
Support levels: 81.00, 79.00, 75.60.
Trading tips
Long positions may be opened from 81.00, with the target at 85.09 and stop loss 79.58. Implementation time: 9–12 days.
Short positions may be opened below 79.58, with the target at 75.60 and stop loss around 81.10.
면책 조항: 본 게시글에 표현된 견해는 전적으로 작성자의 견해이며 Followme의 공식 입장을 대변하지 않습니다. Followme는 제공된 정보의 정확성, 완전성 또는 신뢰성에 대해 책임을 지지 않으며, 서면으로 명시적으로 언급되지 않는 한 해당 내용을 기반으로 취해진 어떠한 조치에 대해서도 책임을 지지 않습니다.

