


| Scenario | |
|---|---|
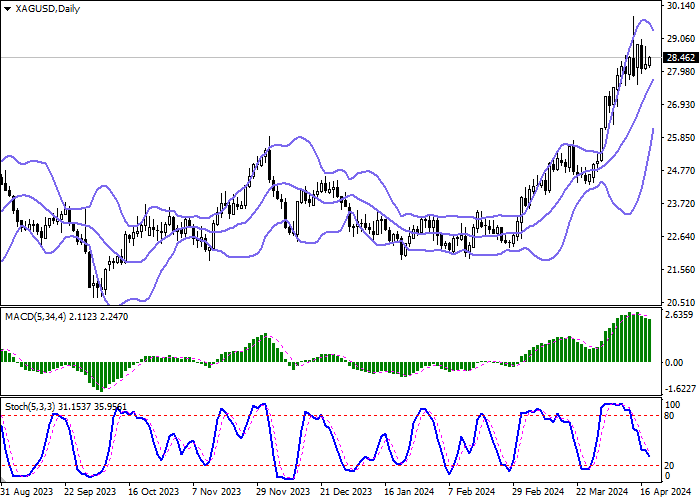
| Timeframe | Intraday |
| Recommendation | SELL STOP |
| Entry Point | 28.00 |
| Take Profit | 27.00 |
| Stop Loss | 28.52 |
| Key Levels | 27.00, 27.33, 27.60, 28.00, 28.52, 28.80, 29.00, 29.35 |
| Alternative scenario | |
|---|---|
| Recommendation | BUY STOP |
| Entry Point | 28.55 |
| Take Profit | 29.35 |
| Stop Loss | 28.00 |
| Key Levels | 27.00, 27.33, 27.60, 28.00, 28.52, 28.80, 29.00, 29.35 |
Current trend
The XAG/USD pair shows moderate growth, developing the uncertain "bullish" impetus formed the day before. The instrument is testing 28.40 for a breakout, while investors are expecting new drivers for price growth. At the moment, the more active rise in quotes is hampered by attempts of the American currency to strengthen against the backdrop of a correction in expectations regarding the imminent launch of a "dovish" monetary policy cycle in the United States.
Earlier, the Chair of the American financial regulator Jerome Powell noted that it will probably take a little longer than initially estimated for inflation to reach target levels of 2.0%. This could lead to the Fed continuing to maintain a wait-and-see approach, putting pressure on silver, which does not earn interest. The situation could change even more with the European Central Bank's (ECB) expected interest rate cut in early summer, while forecasts for the US figure suggest a rate cut only in September.
The focus of investors today will be on Existing Home Sales in the United States: it is expected that in March the figure will decrease from 4.38 million to 4.20 million, while in the previous month Existing Home Sales Change increased by 9.5%. Also, during the day, data on jobless claims will be presented: Initial Jobless Claims for the week ended April 12 is likely to increase from 211.0 thousand to 215.0 thousand.
According to the report from the US Commodity Futures Trading Commission (CFTC), last week the number of net speculative positions in silver increased to 53.2 thousand from 53.1 thousand the week before. The "bulls" maintain an advantage against the backdrop of stabilizing demand for the asset: according to the report on positions secured by real money, their balance is 61.130 thousand versus 22.634 thousand for the "bears". Last week, buyers opened 2.971 thousand new contracts, while sellers reduced their number by 1.442 thousand, indicating complete control over the asset by the "bulls".
Support and resistance
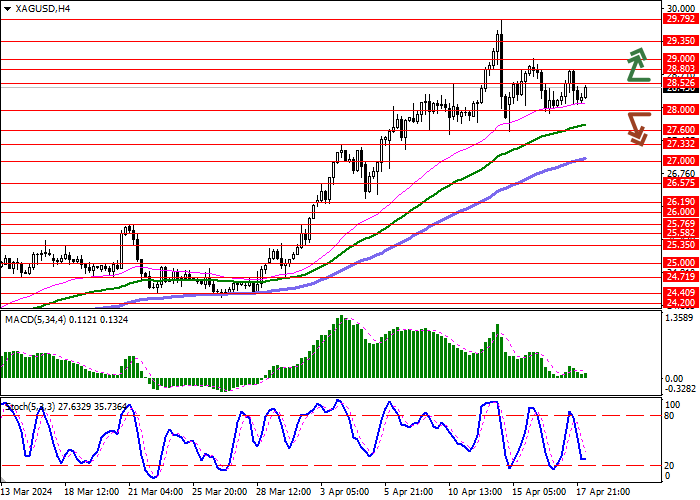
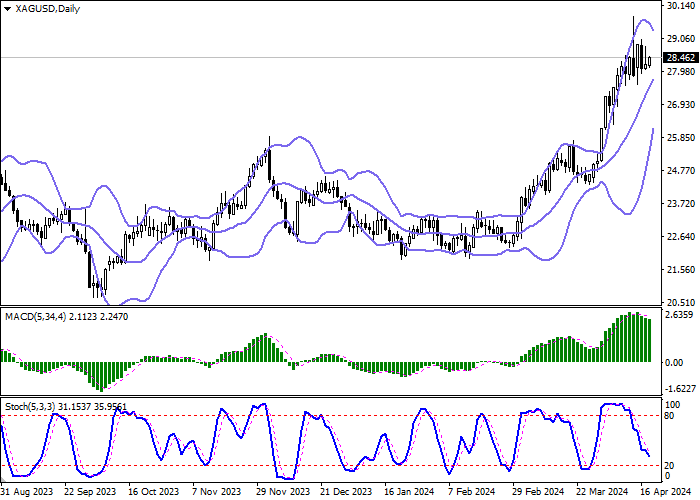
Bollinger Bands on the daily chart show a steady increase. The price range is actively narrowing, reflecting ambiguous nature of trading in the short term. MACD is falling, keeping a relatively strong sell signal (the histogram is below the signal line). Stochastic shows a more confident decline but at the moment it is rapidly approaching its lows, indicating risks of the instrument being oversold in the near future.
Resistance levels: 28.52, 28.80, 29.00, 29.35.
Support levels: 28.00, 27.60, 27.33, 27.00.
Trading tips
Short positions may be opened after a breakdown of 28.00 with the target at 27.00. Stop-loss — 28.52. Implementation time: 2-3 days.
The breakout of 28.52 may be a signal to open new long positions with the target of 29.35. Stop-loss — 28.00.
면책 조항: 본 게시글에 표현된 견해는 전적으로 작성자의 견해이며 Followme의 공식 입장을 대변하지 않습니다. Followme는 제공된 정보의 정확성, 완전성 또는 신뢰성에 대해 책임을 지지 않으며, 서면으로 명시적으로 언급되지 않는 한 해당 내용을 기반으로 취해진 어떠한 조치에 대해서도 책임을 지지 않습니다.

