


| Scenario | |
|---|---|
| Timeframe | Weekly |
| Recommendation | SELL STOP |
| Entry Point | 7840.0 |
| Take Profit | 7710.0 |
| Stop Loss | 7900.0 |
| Key Levels | 7710.0, 7840.0, 7920.0, 8050.0 |
| Alternative scenario | |
|---|---|
| Recommendation | BUY STOP |
| Entry Point | 7920.0 |
| Take Profit | 8050.0 |
| Stop Loss | 7850.0 |
| Key Levels | 7710.0, 7840.0, 7920.0, 8050.0 |
Current trend
The leading index of the London Stock Exchange FTSE 100 is correcting around 7879.0, which is largely caused by unstable macroeconomic statistics and upward dynamics in the bond market.
According to the February report, the Unemployment Rate in the UK rose to 4.2% from 3.9%, which exceeded forecasts, and Claimant Count decreased to 10.9 thousand from 16.8 thousand, with expectations at 17.2 thousand. At the same time, Average Earnings Including Bonus was 5.6%, which coincided with the previous month, and Average Earnings Excluding Bonus decreased to 6.0% from 6.1% a month earlier.
The negative dynamics of the index is also facilitated by the situation on the domestic bond market, where the recent decline has given way to local growth: 10-year bonds are trading at a rate of 4.257%, which exceeds last week’s rate of 4.067%, 20-year bonds increased to 4.736% from 4.552%, and the yield on 30-year bonds was 4.770% after 4.597% a week earlier.
The growth leaders in the index are Beazley Plc. ( 2.98%), Ocado Group Plc. ( 2.02%), IMI Plc. ( 1.98%), B&M European Value Retail SA ( 1.92%).
Among the leaders of the decline are Endeavour Mining Corp. (-7.11%), Fresnillo Plc. (-3.94%), BP Plc. (-2.19%).
Support and resistance
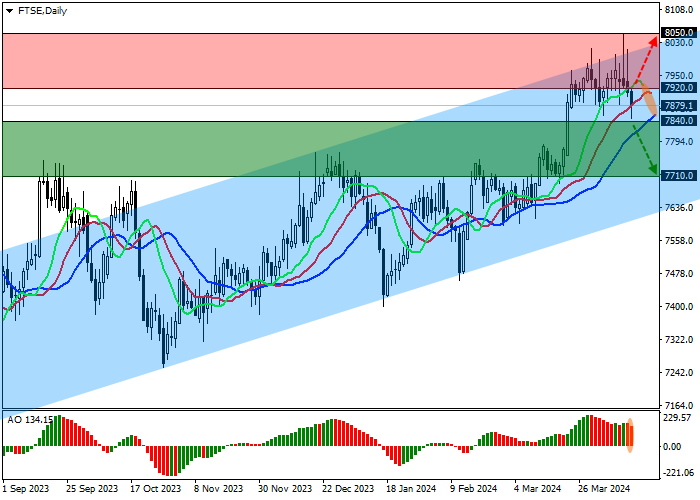
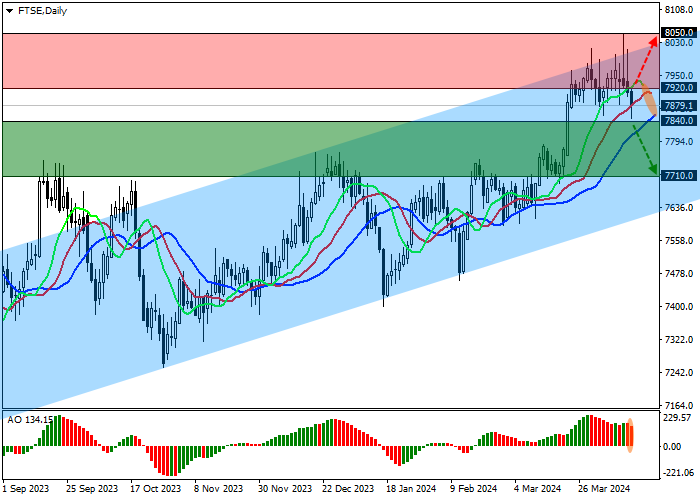
On the daily chart, the index quotes continue their correction, reversing at the resistance line of the ascending channel 8000.0–7600.0.
Technical indicators are in a buy signal state, which has begun to weaken: the EMA fluctuation range on the Alligator indicator has begun to narrow, and the AO histogram is forming new corrective bars, decreasing in the buy zone.
Support levels: 7840.0, 7710.0.
Resistance levels: 7920.0, 8050.0.
Trading tips
If the asset reverses and continues declining, and the price consolidates below 7840.0, short positions can be opened with the target at 7710.0. Stop-loss — 7900.0. Implementation time: 7 days and more.
If the index continues growing, and the price consolidates above the resistance at 7920.0, long positions with a target of 8050.0 and stop-loss of 7850.0 will be relevant.
면책 조항: 본 게시글에 표현된 견해는 전적으로 작성자의 견해이며 Followme의 공식 입장을 대변하지 않습니다. Followme는 제공된 정보의 정확성, 완전성 또는 신뢰성에 대해 책임을 지지 않으며, 서면으로 명시적으로 언급되지 않는 한 해당 내용을 기반으로 취해진 어떠한 조치에 대해서도 책임을 지지 않습니다.

