


| Scenario | |
|---|---|
| Timeframe | Weekly |
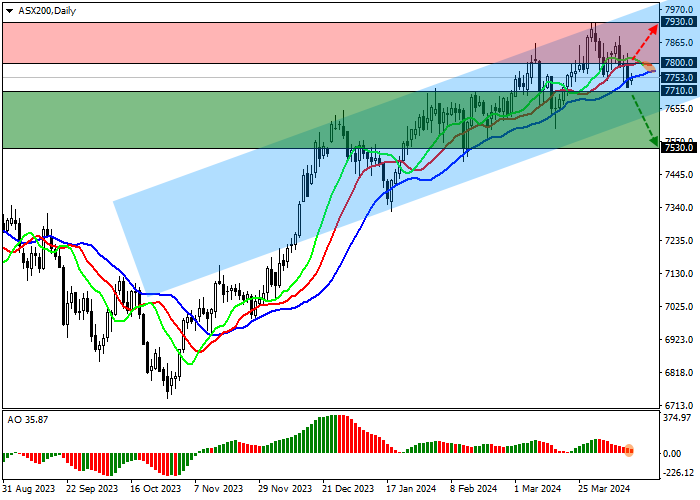
| Recommendation | SELL STOP |
| Entry Point | 7710.0 |
| Take Profit | 7530.0 |
| Stop Loss | 7800.0 |
| Key Levels | 7530.0, 7710.0, 7800.0, 7930.0 |
| Alternative scenario | |
|---|---|
| Recommendation | BUY STOP |
| Entry Point | 7800.0 |
| Take Profit | 7930.0 |
| Stop Loss | 7720.0 |
| Key Levels | 7530.0, 7710.0, 7800.0, 7930.0 |
Current trend
The leading index of the Australian economy ASX 200 shows corrective dynamics near the 7753.0 mark. The corporate reporting season starts this week: for example, today the financial results of the mining company Rio Tinto Ltd., as well as the electricity producer Origin Energy Ltd. will be presented.
Investors evaluate macroeconomic statistics and the situation on the bond market. Last week, a report on turnover in the mining industry, which is one of the key indicators for the national economy, was published, reflecting a 9.6% drop in volumes in February, although only three of the thirteen regions experienced a decrease. The main factor for the negative dynamics was a decrease in prices for commodities, in particular for iron ore, which led to a correction in production by -13.8%.
There is an uptrend in the domestic bond market: 10-year securities are trading at a rate of 4.285%, which exceeds 4.164% recorded last week, the yield of 20-year bonds rose to 4.644% from 4.547%, and the rate on 30-year bonds grew to 4.627% from 4.506%.
The growth leaders in the index are Alumina Ltd. ( 6.50%), South32 Ltd. ( 4.41%), Nickel Mines Ltd. ( 4.65%), Rio Tinto Ltd. ( 3.76%).
Among the leaders of the decline are Appen Ltd. (-8.07%), St Gold Road Resources Ltd. (-7.28%), Star Entertainment Group Ltd. (-4.46%), Star Entertainment Group Ltd. (-4.46%).
Support and resistance
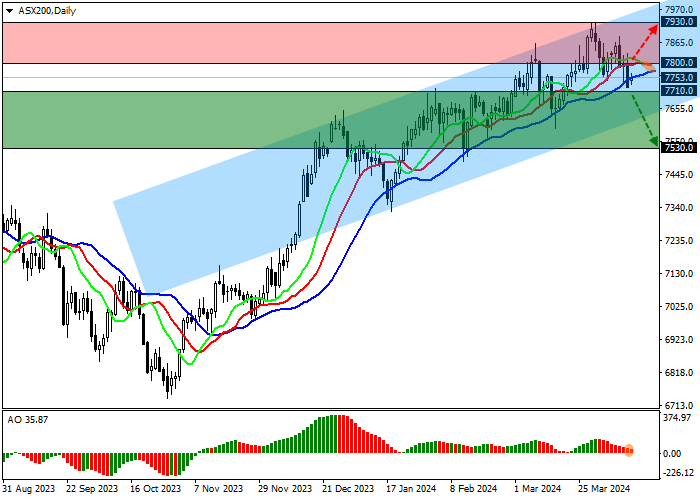
On the D1 chart, the price is trading in the 8000.0–7650.0 channel, holding within the new downward wave.
Technical indicators are ready to reverse around and issue a new sell signal: the fast EMAs of the Alligator indicator are held above the signal line, but they are rapidly approaching it, and the AO histogram forms corrective bars, while declining in the purchase zone.
Support levels: 7710.0, 7530.0.
Resistance levels: 7800.0, 7930.0.
Trading tips
In the event of a reversal and continued decline of the asset with consolidation below the 7710.0 mark, sell positions with the target of 7530.0 can be opened. Stop-loss – 7800.0. Implementation time: 7 days and more.
In case of continued growth of the asset, as well as price consolidation above the resistance level of 7800.0, buy positions with the target of 7930.0 and stop-loss of 7720.0 will be relevant.
면책 조항: 본 게시글에 표현된 견해는 전적으로 작성자의 견해이며 Followme의 공식 입장을 대변하지 않습니다. Followme는 제공된 정보의 정확성, 완전성 또는 신뢰성에 대해 책임을 지지 않으며, 서면으로 명시적으로 언급되지 않는 한 해당 내용을 기반으로 취해진 어떠한 조치에 대해서도 책임을 지지 않습니다.

