


· Views 125
면책 조항: 본 게시글에 표현된 견해는 전적으로 작성자의 견해이며 Followme의 공식 입장을 대변하지 않습니다. Followme는 제공된 정보의 정확성, 완전성 또는 신뢰성에 대해 책임을 지지 않으며, 서면으로 명시적으로 언급되지 않는 한 해당 내용을 기반으로 취해진 어떠한 조치에 대해서도 책임을 지지 않습니다.
이 글이 마음에 드시나요? 작성자에게 팁을 보내 감사의 마음을 전하세요.
| Scenario | |
|---|---|
| Timeframe | Weekly |
| Recommendation | BUY STOP |
| Entry Point | 50.05 |
| Take Profit | 51.56, 53.12 |
| Stop Loss | 49.30 |
| Key Levels | 46.09, 46.88, 48.44, 50.00, 51.56, 53.12 |
| Alternative scenario | |
|---|---|
| Recommendation | SELL STOP |
| Entry Point | 48.40 |
| Take Profit | 46.88, 46.09 |
| Stop Loss | 49.00 |
| Key Levels | 46.09, 46.88, 48.44, 50.00, 51.56, 53.12 |
Current trend
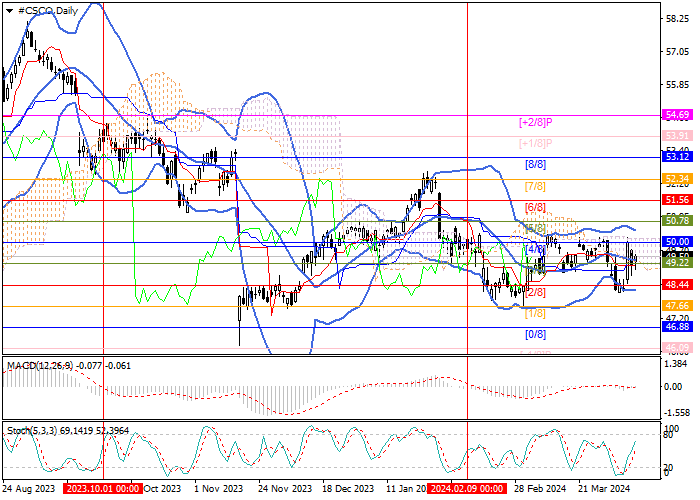
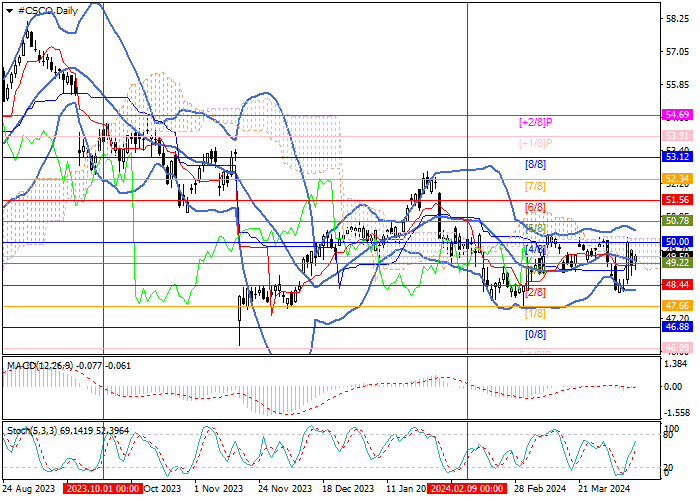
Shares of Cisco Systems Inc., an American manufacturer and supplier of network equipment for large holdings and telecommunications companies, have been trading in a sideways range of 50.00–48.44 (Murrey level [4/8]–[2/8]) for the third month and cannot leave it yet. The quotes are preparing to test the central mark of Murrey’s trading range 50.00 (Murrey level [4/8]), after which growth to the area of 51.56 (Murrey level [6/8]) and 53.12 (Murrey level [8/8]) is expected. In the event of a breakdown of the key “bearish” lower border of the range 48.44 (Murrey level [2/8]), a decrease to the area of 46.88 (Murrey level [0/8]) and 46.09 (Murrey level [–1/8]) is expected.
Technical indicators do not give a single signal: Bollinger Bands are horizontal, the MACD histogram is at the zero line, and its volumes are insignificant but Stochastic reversed upwards, not excluding continued growth soon.
Support and resistance
Resistance levels: 50.00, 51.56, 53.12.
Support levels: 48.44, 46.88, 46.09.
Trading tips
Long positions may be opened above the 50.00 level, with the targets at 51.56, 53.12, and stop loss 49.30. Implementation time: 5–7 days.
Short positions should be opened below 48.44, with the targets at 46.88, 46.09, and stop loss around 49.00.
면책 조항: 본 게시글에 표현된 견해는 전적으로 작성자의 견해이며 Followme의 공식 입장을 대변하지 않습니다. Followme는 제공된 정보의 정확성, 완전성 또는 신뢰성에 대해 책임을 지지 않으며, 서면으로 명시적으로 언급되지 않는 한 해당 내용을 기반으로 취해진 어떠한 조치에 대해서도 책임을 지지 않습니다.

