


| Scenario | |
|---|---|
| Timeframe | Weekly |
| Recommendation | SELL STOP |
| Entry Point | 38100.0 |
| Take Profit | 37100.0 |
| Stop Loss | 38500.0 |
| Key Levels | 37100.0, 38100.0, 38700.0, 39500.0 |
| Alternative scenario | |
|---|---|
| Recommendation | BUY STOP |
| Entry Point | 38700.0 |
| Take Profit | 39500.0 |
| Stop Loss | 38300.0 |
| Key Levels | 37100.0, 38100.0, 38700.0, 39500.0 |
Current trend
The Dow Jones index is correcting in the local trend at 38443.0: the dynamics of the leading stock instruments still depends on the situation on the bond market, as well as macroeconomic statistics.
Investors fear that the data on the consumer price index (CPI), presented yesterday, may make serious adjustments to the plans of the US Federal Reserve to begin easing monetary policy: in March, the indicator increased by the same 0.4% MoM, contrary to forecasts of 0.3%, and rose from 3.2% to 3.5% YoY, ahead of experts' expectations of 3.4%. The base value excluding food and energy adjusted by 0.4% MoM and by 3.8% YoY, respectively, as in the previous period, above the projected slowdown to 0.3% and 3.7%. According to the Chicago Mercantile Exchange (CME Group) instrument FedWatch Tool, the probability of an interest rate cut in June is now estimated at only 60.0% compared to 81.3% of keeping it at the current level, therefore, the increased debt burden will not allow national businesses to invest in development, and stock instruments will again come under pressure.
Leading bonds accelerated growth: 10-year securities are trading at a rate of 4.543%, exceeding Monday's value at 4.365%, the yield of 20-year bonds reached 4.752% after 4.599% recorded at the beginning of the week, and the rate on 30-year securities increased to 4.628% from 4.505%.
The growth leaders in the index are Walmart Inc. ( 1.39%), Chevron Corp. ( 0.41%), Procter & Gamble Co. ( 0,37%).
Among the leaders of the decline are Home Depot Inc. (-3.00%), Intel Corp. (-2.95%), Goldman Sachs Group Inc. (-2.42%).
Support and resistance
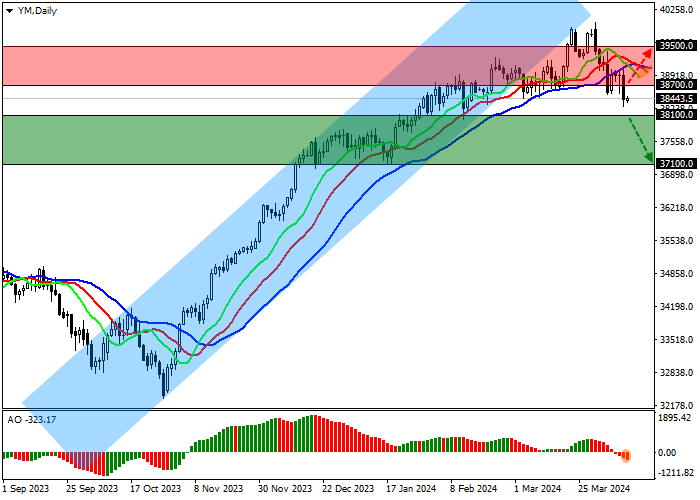
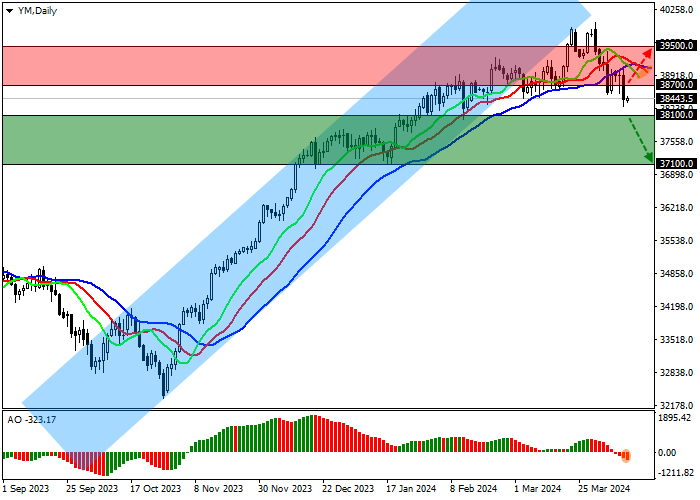
On the D1 chart, the index quotes continue their downward correction dynamics, still holding below the support line of the 40000.0–38700.0 channel.
Technical indicators have reversed, maintaining a sell signal, which is strengthening every day: the range of fluctuations of the EMAs of the Alligator indicator is expanding, and the AO histogram is forming new correction bars, being below the transition level.
Support levels: 38100.0, 37100.0.
Resistance levels: 38700.0, 39500.0.
Trading tips
In the event of a reversal and continued decline of the asset, as well as price consolidation below the support level of 38100.0, sell positions with the target of 37100.0 may be opened. Stop-loss – 38500.0. Implementation time: 7 days and more.
If the asset continues to grow, buy positions can be opened after overcoming the resistance level of 38700.0 with the target of 39500.0 and stop-loss of 38300.0.
면책 조항: 본 게시글에 표현된 견해는 전적으로 작성자의 견해이며 Followme의 공식 입장을 대변하지 않습니다. Followme는 제공된 정보의 정확성, 완전성 또는 신뢰성에 대해 책임을 지지 않으며, 서면으로 명시적으로 언급되지 않는 한 해당 내용을 기반으로 취해진 어떠한 조치에 대해서도 책임을 지지 않습니다.

