


| Scenario | |
|---|---|
| Timeframe | Intraday |
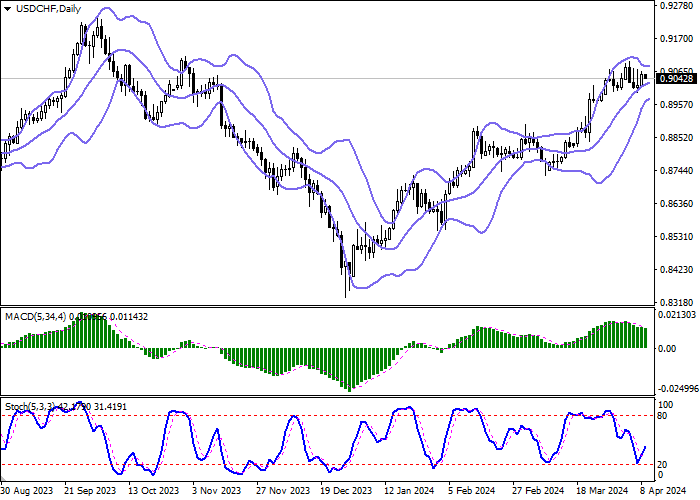
| Recommendation | SELL STOP |
| Entry Point | 0.9035 |
| Take Profit | 0.8964 |
| Stop Loss | 0.9071 |
| Key Levels | 0.8935, 0.8964, 0.9000, 0.9037, 0.9071, 0.9100, 0.9130, 0.9150 |
| Alternative scenario | |
|---|---|
| Recommendation | BUY STOP |
| Entry Point | 0.9075 |
| Take Profit | 0.9130 |
| Stop Loss | 0.9037 |
| Key Levels | 0.8935, 0.8964, 0.9000, 0.9037, 0.9071, 0.9100, 0.9130, 0.9150 |
Current trend
During the Asian session, the USD/CHF pair decreased slightly, consolidating near 0.9040: yesterday, the American dollar was actively growing, but now trading participants are in no hurry to open new positions, waiting for new drivers for the movement of the instrument to emerge.
The quotes continue to be supported by strong labor market data published at the end of last week: in March, nonfarm payrolls increased from 270.0K to 303.0K compared to forecasts of 200.0K, the unemployment rate adjusted from 3.9% to 3.8%, the average hourly wage – from 0.2% to 0.3% MoM and from 4.3% to 4.1% YoY. Statistics confirm the current doubts regarding the US Fed interest rate cut during the June meeting: more and more analysts believe that the launch of the monetary easing program will be delayed until the end of 2024. In this regard, the head of the Federal Reserve Bank (FRB) of Dallas, Laurie Logan, said that the danger of stabilizing inflation above the target level remains, and, therefore, a sharp transition to the “dovish” rhetoric is impossible. A similar opinion was expressed by US Fed Board member Michelle Bowman, noting that due to the continued risks of a new acceleration in consumer price growth, it is premature to begin reducing borrowing costs.
In turn, macroeconomic statistics from Switzerland exerted some pressure on the franc: in March, the unemployment rate increased from 2.2% to 2.3%, which, however, remains low for the region.
Support and resistance
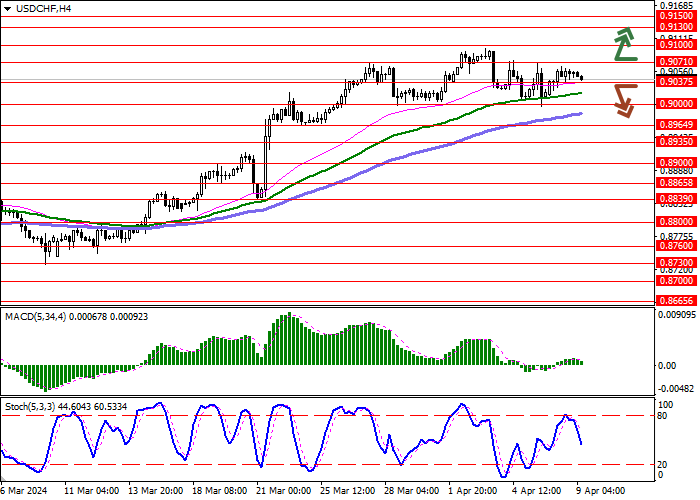
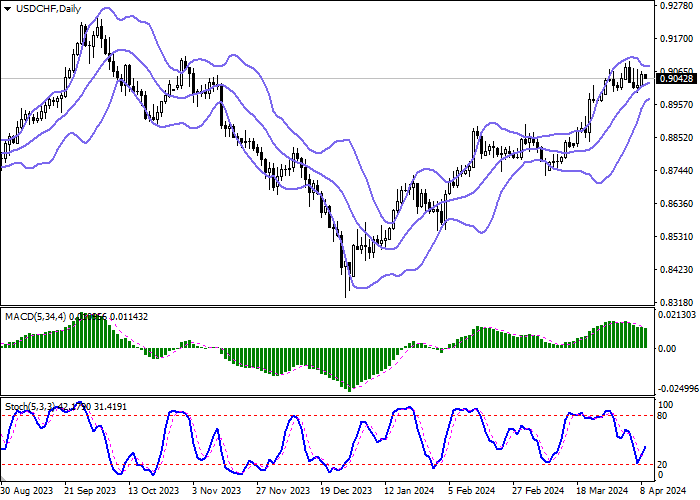
On the daily chart, Bollinger Bands are trying to reverse horizontally: the price range changes slightly, remaining wide enough for the market activity. The MACD indicator is declining, maintaining a sell signal: the histogram is below the signal line. Stochastic retreated from the “20” mark, reversed upwards, and is signaling in favor of the development of the “bullish” dynamics soon.
Resistance levels: 0.9071, 0.9100, 0.9130, 0.9150.
Support levels: 0.9037, 0.9000, 0.8964, 0.8935.
Trading tips
Short positions may be opened after a breakdown of 0.9037, with the target at 0.8964. Stop loss – 0.9071. Implementation time: 1–2 days.
Long positions may be opened after a breakout of 0.9071, with the target at 0.9130. Stop loss – 0.9037.
면책 조항: 본 게시글에 표현된 견해는 전적으로 작성자의 견해이며 Followme의 공식 입장을 대변하지 않습니다. Followme는 제공된 정보의 정확성, 완전성 또는 신뢰성에 대해 책임을 지지 않으며, 서면으로 명시적으로 언급되지 않는 한 해당 내용을 기반으로 취해진 어떠한 조치에 대해서도 책임을 지지 않습니다.

