


· Views 117
면책 조항: 본 게시글에 표현된 견해는 전적으로 작성자의 견해이며 Followme의 공식 입장을 대변하지 않습니다. Followme는 제공된 정보의 정확성, 완전성 또는 신뢰성에 대해 책임을 지지 않으며, 서면으로 명시적으로 언급되지 않는 한 해당 내용을 기반으로 취해진 어떠한 조치에 대해서도 책임을 지지 않습니다.
이 글이 마음에 드시나요? 작성자에게 팁을 보내 감사의 마음을 전하세요.
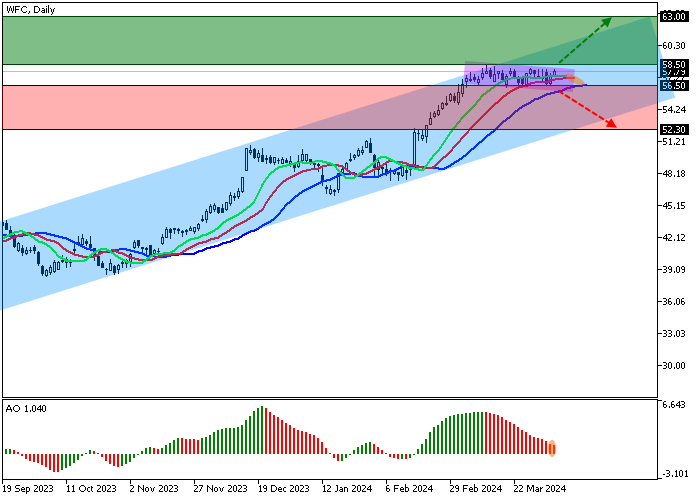
| Scenario | |
|---|---|
| Timeframe | Weekly |
| Recommendation | BUY STOP |
| Entry Point | 58.50 |
| Take Profit | 63.00 |
| Stop Loss | 57.00 |
| Key Levels | 52.30, 54.00, 56.30, 57.00, 58.00, 58.20, 62.00, 63.00 |
| Alternative scenario | |
|---|---|
| Recommendation | SELL STOP |
| Entry Point | 56.50 |
| Take Profit | 52.30 |
| Stop Loss | 58.00 |
| Key Levels | 52.30, 54.00, 56.30, 57.00, 58.00, 58.20, 62.00, 63.00 |
Shares of Wells Fargo & Co., one of the leading banking and insurance companies in the United States, are trading at 58.00.
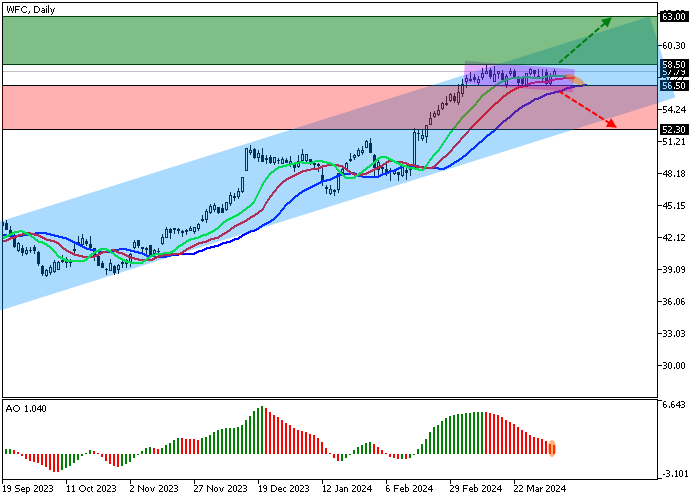
On the daily chart, the price is moving in a corrective trend, staying within the ascending corridor of 62.00–54.00.
On the four-hour chart, after reaching the channel resistance line of 58.00, the quotes began to form a corrective downward channel with dynamic boundaries of 58.20–56.30, which can work as a Flag trend continuation pattern, and the upward dynamics will reach 63.00.
Technical indicators are slowing down the buy signal against a correction: fast EMAs of the Alligator indicator are above the signal line, narrowing the range of fluctuations, and the AO histogram forms corrective bars above the transition level.
Trading tips
Long positions may be opened after the price rises and consolidates above 58.50, with the target at 63.00. Stop loss – 57.00. Implementation period: 7 days or more.
Short positions may be opened after the price declines and consolidates below 56.50, with the target at 52.30. Stop loss – 58.00.
면책 조항: 본 게시글에 표현된 견해는 전적으로 작성자의 견해이며 Followme의 공식 입장을 대변하지 않습니다. Followme는 제공된 정보의 정확성, 완전성 또는 신뢰성에 대해 책임을 지지 않으며, 서면으로 명시적으로 언급되지 않는 한 해당 내용을 기반으로 취해진 어떠한 조치에 대해서도 책임을 지지 않습니다.

