


| Scenario | |
|---|---|
| Timeframe | Weekly |
| Recommendation | BUY STOP |
| Entry Point | 1.3610 |
| Take Profit | 1.3671, 1.3732, 1.3793 |
| Stop Loss | 1.3565 |
| Key Levels | 1.3305, 1.3366, 1.3488, 1.3610, 1.3671, 1.3732, 1.3793 |
| Alternative scenario | |
|---|---|
| Recommendation | SELL STOP |
| Entry Point | 1.3485 |
| Take Profit | 1.3366, 1.3305 |
| Stop Loss | 1.3570 |
| Key Levels | 1.3305, 1.3366, 1.3488, 1.3610, 1.3671, 1.3732, 1.3793 |
Current trend
The USD/CAD pair is trading within the ascending channel, currently holding at 1.3578: in the medium term, the US currency remains under pressure amid investors' expectation of an early easing of the monetary policy of the US Federal Reserve, which is increasingly confirmed both among economic statistics and official comments.
The February price index of personal consumption expenditures published on Friday fell from 2.9% to 2.8%, and the head of the regulator, Jerome Powell, noted that the slowdown in inflation was in line with officials' expectations. Yesterday, two members of the US Federal Reserve – Presidents of the Cleveland Federal Reserve Bank (FRB) Loretta Mester and the San Francisco FRB Mary Daly called for a three-fold reduction in rates during the year, despite the inflationary surge in January-February. All this strengthens the hopes of market participants for a correction of monetary policy in June, weakening the position of the US dollar against alternative assets. On Friday, investors expect the publication of March data on the US labor market, which is likely to confirm its further cooling: employment may slow down to 205.0 thousand, and the average hourly wage to 4.1%, acting as a driver of the depreciation of the USD/CAD pair.
Unlike the US Federal Reserve, representatives of the Bank of Canada are in no hurry to announce clear deadlines for lowering interest rates, despite the slowdown in inflation in February to 2.1% YoY, which provides the Canadian currency with some stability. Experts expect changes in the current monetary rate no earlier than the middle of the year.
Support and resistance
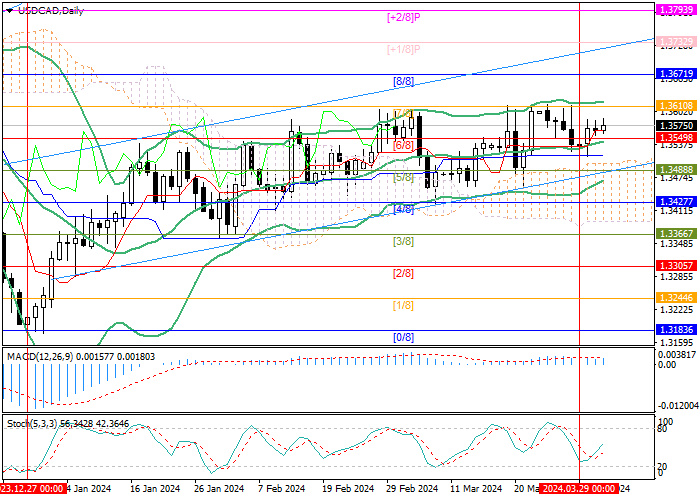
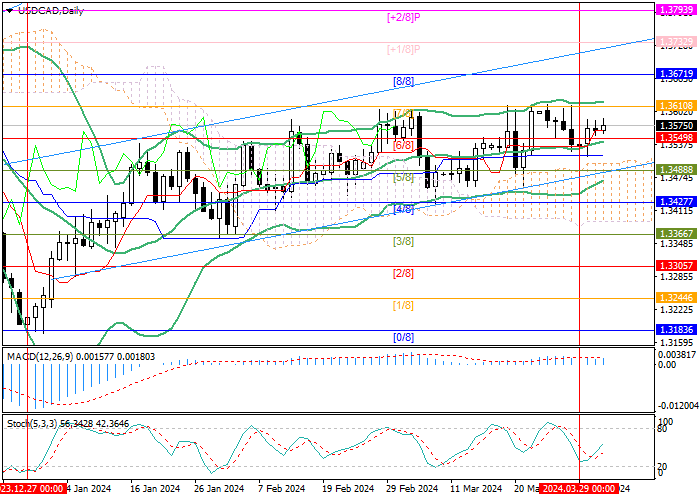
Technically, the instrument is close to the 1.3610 mark (Murrey level [7/8]), which it repeatedly unsuccessfully tested last month. Consolidating above it will allow quotes to develop upward dynamics towards the targets of 1.3671 (Murrey level [8/8]), 1.3732 (Murrey level [ 1/8]), 1.3793 (Murrey level [ 2/8]). The key for the "bears" is the level of 1.3488 (Murrey level [5/8]), the breakdown of which will lead to the exit of quotes from the ascending channel and the development of downward dynamics to the levels of 1.3366 (Murrey level [3/8]) and 1.3305 (Murrey level [2/8]).
Technical indicators confirm the probability of continued growth: Bollinger Bands and Stochastic are reversing up, MACD is stable in the positive zone.
Resistance levels: 1.3610, 1.3671, 1.3732, 1.3793.
Support levels: 1.3488, 1.3366, 1.3305.
Trading tips
Long positions can be opened above 1.3610 with targets of 1.3671, 1.3732, 1.3793 and stop-loss of 1.3565. Implementation period: 5–7 days.
Short positions should be opened below the 1.3488 mark with targets of 1.3366, 1.3305 and stop-loss of 1.3570.
면책 조항: 본 게시글에 표현된 견해는 전적으로 작성자의 견해이며 Followme의 공식 입장을 대변하지 않습니다. Followme는 제공된 정보의 정확성, 완전성 또는 신뢰성에 대해 책임을 지지 않으며, 서면으로 명시적으로 언급되지 않는 한 해당 내용을 기반으로 취해진 어떠한 조치에 대해서도 책임을 지지 않습니다.

