


| Scenario | |
|---|---|
| Timeframe | Weekly |
| Recommendation | BUY STOP |
| Entry Point | 87.80 |
| Take Profit | 90.70 |
| Stop Loss | 86.00 |
| Key Levels | 82.50, 86.20, 87.80, 90.70 |
| Alternative scenario | |
|---|---|
| Recommendation | SELL STOP |
| Entry Point | 86.20 |
| Take Profit | 82.50 |
| Stop Loss | 88.00 |
| Key Levels | 82.50, 86.20, 87.80, 90.70 |
Current trend
Benchmark Brent Crude Oil prices are rising moderately, trading at 87.00, supported by OPEC countries’ decision to continue voluntary production cuts in the 2024 Q2.
Thus, the total decline from April to June will be 2.17M barrels per day, almost identical to the reduction of 2.18M barrels per day in the first quarter. Saudi Arabia will adhere to the adjustment by 1.0M barrels per day, the United Arab Emirates – by 163.0K barrels per day, Kuwait – by 135.0K barrels per day, Kazakhstan – by 82.0K barrels per day, Algeria – by 51.0K barrels per day, and Oman – by 42.0K barrels per day. In Iraq, the change could be 223.0K barrels per day instead of 220.0K barrels per day previously. As for the Russian Federation, in addition to a decrease in exports of 500.0K barrels per day, a decrease in production will also be added, totaling around 471.0K barrels per day.
Another fact that could affect the quotes was a message from the United States about a new package of sanctions against the Venezuelan oil sector. Thus, the Joe Biden administration said it could ban the country from selling its oil in dollars. Experts suggest that, in this case, payments will be made in bolivars, and the payments will be issued as write-offs of public debt. It is still difficult to assess how much this will affect Venezuelan exports but it is possible that there may be proposals from buyers to transfer payments to other currencies, which will be more profitable for the seller.
Support and resistance
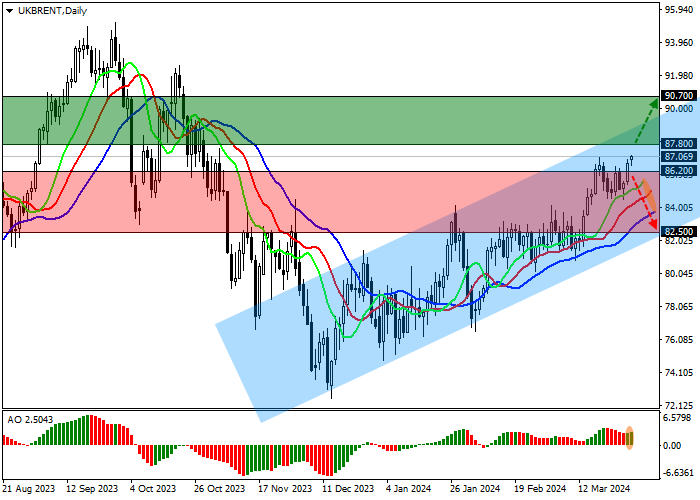
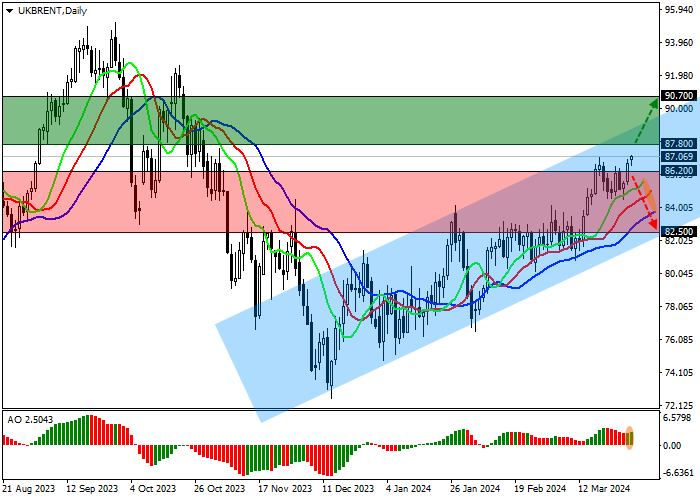
On the daily chart, the trading instrument is moving in a corrective trend towards the resistance line of the ascending corridor 90.00–82.00.
Technical indicators support the correction, maintaining a buy signal: fast EMA of the Alligator indicator are above the signal line, and the AO histogram forms corrective bars in the buy zone.
Resistance levels: 86.20, 82.50.
Support levels: 87.80, 90.70.
Trading tips
Long positions may be opened after the price rises and consolidates above 87.80 with the target at 90.70. Stop loss – 86.00. Implementation period: 7 days or more.
Short positions may be opened after the price declines and consolidates below 86.20 with the target at 82.50. Stop loss – 88.00.
면책 조항: 본 게시글에 표현된 견해는 전적으로 작성자의 견해이며 Followme의 공식 입장을 대변하지 않습니다. Followme는 제공된 정보의 정확성, 완전성 또는 신뢰성에 대해 책임을 지지 않으며, 서면으로 명시적으로 언급되지 않는 한 해당 내용을 기반으로 취해진 어떠한 조치에 대해서도 책임을 지지 않습니다.

