


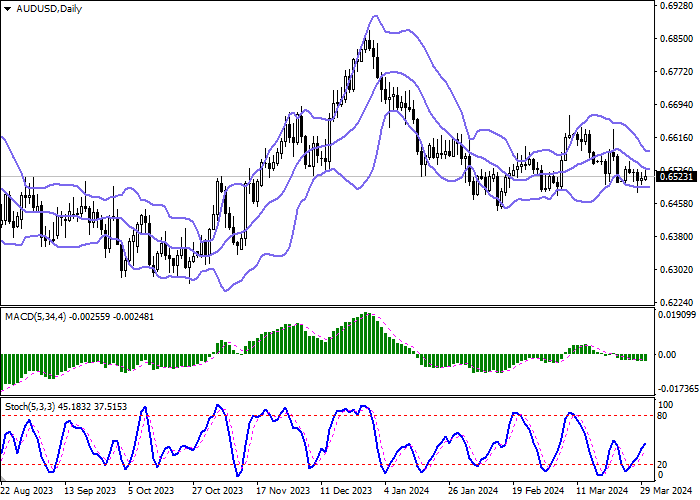
| Scenario | |
|---|---|
| Timeframe | Intraday |
| Recommendation | BUY STOP |
| Entry Point | 0.6540 |
| Take Profit | 0.6578 |
| Stop Loss | 0.6524 |
| Key Levels | 0.6468, 0.6484, 0.6500, 0.6524, 0.6540, 0.6558, 0.6578, 0.6600 |
| Alternative scenario | |
|---|---|
| Recommendation | SELL STOP |
| Entry Point | 0.6500 |
| Take Profit | 0.6468 |
| Stop Loss | 0.6520 |
| Key Levels | 0.6468, 0.6484, 0.6500, 0.6524, 0.6540, 0.6558, 0.6578, 0.6600 |
Current trend
The AUD/USD pair is showing faltering gains as it tries to recover from last week's mostly "bearish" trading dynamics, which resulted in updating of local lows from March 5. The instrument is testing the level of 0.6520, receiving support from macroeconomic statistics from China.
The Caixin Manufacturing PMI in March rose from 50.9 points to 51.1 points, with a forecast of 51.0 points. Last weekend, China also released business activity data from the China Federation of Logistics and Purchasing (CFLP): the Manufacturing PMI rose from 49.1 points to 50.8 points, which was higher than expected at 49.9 points, and the Services PMI - from 51.4 points to 53.0 points. After the Chinese government lifted tariffs on Australian coal, barley and wine, officials intend to push for similar barriers to be removed on beef and seafood exports. The likelihood of a positive resolution of these issues is quite high, as political and economic relations between China and Australia continue to improve. Beijing introduced a number of protective duties on Australian goods back in 2020, when official Canberra called for an investigation into the origins of the coronavirus, but the dialogue between the countries has now resumed.
Today, the US will also present statistics on business activity: forecasts suggest that the Manufacturing PMI from the Institute for Supply Management (ISM) will increase from 47.8 points to 48.4 points. Tomorrow, investors will evaluate data from Australia on business activity in the manufacturing sector from S&P, as well as updated inflation data from TD Securities. In addition, the minutes of the Reserve Bank of Australia's March monetary policy meeting will be published throughout the day.
Support and resistance
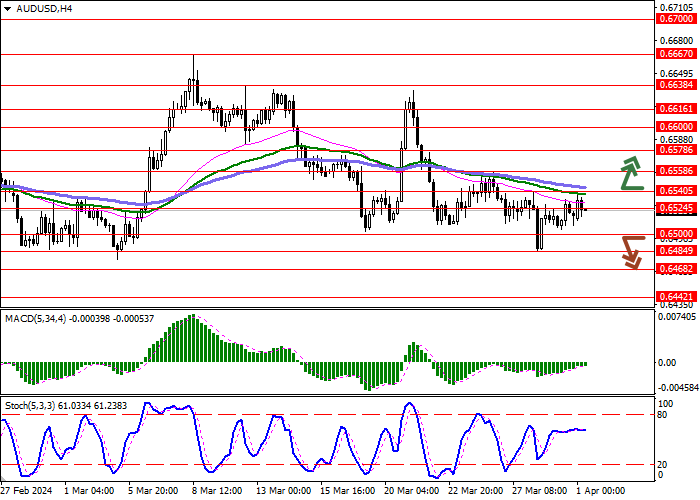
In the D1 chart, Bollinger Bands are reversing horizontally. The price range is almost constant, remaining rather spacious for the current level of activity in the market. MACD indicator tries to reverse to growth and to form a new buy signal (the histogram is about to consolidate above the signal line). Stochastic is showing more active growth and is currently located approximately in the center of its area, signaling sufficient potential for "bullish" dynamics in the ultra-short term.
Resistance levels: 0.6540, 0.6558, 0.6578, 0.6600.
Support levels: 0.6524, 0.6500, 0.6484, 0.6468.
Trading tips
Long positions can be opened after a breakout of 0.6540 with the target of 0.6578. Stop-loss — 0.6524. Implementation time: 2-3 days.
The return of a "bearish" trend with the breakdown of 0.6500 may become a signal for new short positions with the target at 0.6468. Stop-loss — 0.6520.
면책 조항: 본 게시글에 표현된 견해는 전적으로 작성자의 견해이며 Followme의 공식 입장을 대변하지 않습니다. Followme는 제공된 정보의 정확성, 완전성 또는 신뢰성에 대해 책임을 지지 않으며, 서면으로 명시적으로 언급되지 않는 한 해당 내용을 기반으로 취해진 어떠한 조치에 대해서도 책임을 지지 않습니다.

