


| Scenario | |
|---|---|
| Timeframe | Weekly |
| Recommendation | BUY STOP |
| Entry Point | 69000.00 |
| Take Profit | 75000.00, 81250.00, 87500.00 |
| Stop Loss | 64500.00 |
| Key Levels | 50000.00, 56250.00, 61150.00, 68750.00, 75000.00, 81250.00, 87500.00 |
| Alternative scenario | |
|---|---|
| Recommendation | SELL STOP |
| Entry Point | 61100.00 |
| Take Profit | 56250.00, 50000.00 |
| Stop Loss | 65600.00 |
| Key Levels | 50000.00, 56250.00, 61150.00, 68750.00, 75000.00, 81250.00, 87500.00 |
Current trend
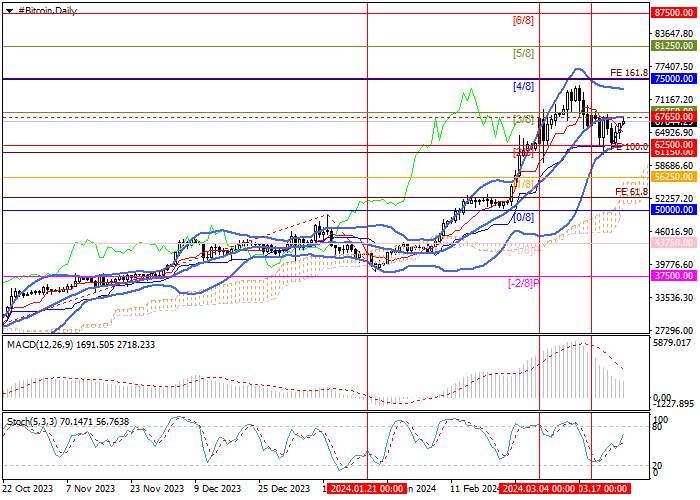
Last week, the BTC/USD pair continued its downward correction, reaching three-week lows in the area of 60750.00, however, over the weekend, the growth of quotes resumed, and now they are in the area of 67000.00. Experts believe that sellers' pressure on the market is weakening, and many investors are switching to purchases amid lower prices.
A positive trend for the cryptocurrency market is a significant weakening in the rate of net outflow of funds from bitcoin ETFs: if in the first three trading sessions of last week, it amounted to 742.0 million dollars, then after the meeting of the US Federal Reserve — only 145.6 million dollars in two days. In addition, the statements of the monetary authorities contributed to the resumption of the upward dynamics of tokens. The regulator confirmed the forecast of a three-times decrease in the cost of borrowing during the year, and the head of the US Fed Jerome Powell stressed that the increase in inflationary pressure in January-February did not change the general trend towards a slowdown in consumer price growth. Thus, investors continue to hope for the beginning of monetary policy easing in June, which supports the growth of alternative assets against the US currency. There is also a factor of expectation of halving in the Bitcoin network, which continues to contribute to the preservation of investor interest in cryptocurrencies in the near future.
Support and resistance
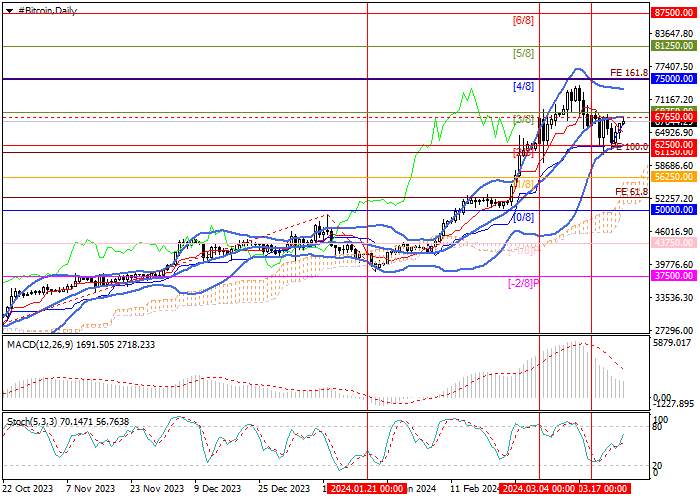
The quotes reached the support zone of 67650.00–68750.00 (the central line of Bollinger Bands, Murrey level [3/8]), the breakout of which will allow growth to continue to 75000.00 (Murrey level [4/8], 161.8% Fibonacci extension), 81250.00 (Murrey level [5/8]), and 87500.00 (Murrey level [6/8]). The key for the "bears" is the 61150.00 mark (Fibonacci extension of 100.0%), after consolidation below which the decline can continue to the targets of 56250.00 (Murrey level [1/8]) and 50000.00 (Murrey level [0/8]).
Technical indicators do not give a clear signal: Bollinger Bands are horizontal, MACD is stable in the positive zone, while Stochastic is directed upwards.
Resistance levels: 68750.00, 75000.00, 81250.00, 87500.00.
Support levels: 61150.00, 56250.00, 50000.00.
Trading tips
Long positions can be opened above the 68750.00 mark with targets of 75000.00, 81250.00, 87500.00 and stop-loss of 64500.00.
Short positions can be opened below the level of 61150.00 with targets of 56250.00, 50000.00 and stop-loss of 65600.00. Implementation period: 5–7 days.
면책 조항: 본 게시글에 표현된 견해는 전적으로 작성자의 견해이며 Followme의 공식 입장을 대변하지 않습니다. Followme는 제공된 정보의 정확성, 완전성 또는 신뢰성에 대해 책임을 지지 않으며, 서면으로 명시적으로 언급되지 않는 한 해당 내용을 기반으로 취해진 어떠한 조치에 대해서도 책임을 지지 않습니다.

더 오래된 의견은 없습니다. 소파를 가장 먼저 잡으십시오.