
| Scenario | |
|---|---|
| Timeframe | Intraday |
| Recommendation | SELL STOP |
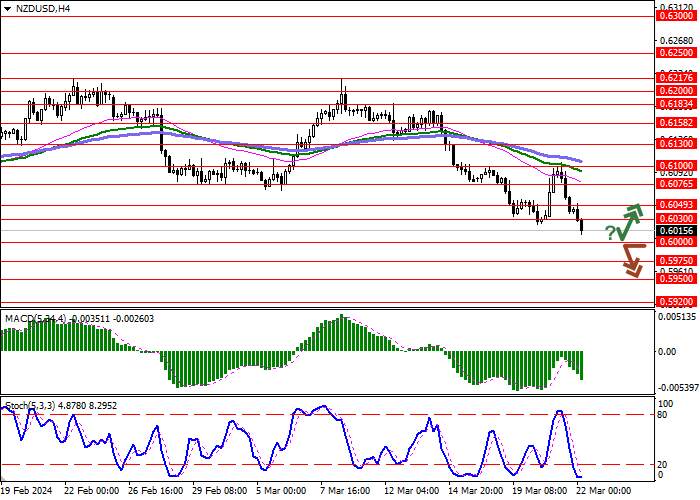
| Entry Point | 0.6000 |
| Take Profit | 0.5950 |
| Stop Loss | 0.6030 |
| Key Levels | 0.5920, 0.5950, 0.5975, 0.6000, 0.6030, 0.6049, 0.6076, 0.6100 |
| Alternative scenario | |
|---|---|
| Recommendation | BUY STOP |
| Entry Point | 0.6030 |
| Take Profit | 0.6100 |
| Stop Loss | 0.6000 |
| Key Levels | 0.5920, 0.5950, 0.5975, 0.6000, 0.6030, 0.6049, 0.6076, 0.6100 |
Current trend
The NZD/USD pair shows a moderate decline, developing a downward trend in the short term and updating the local lows of November 2023. The instrument is testing 0.6015 for a breakdown, while the US currency is supported by growing demand for risky assets and cooling expectations regarding an imminent reduction in borrowing costs from the US Federal Reserve.
A meeting of the American regulator was held this week, following which monetary policy remained unchanged. At the same time, the Fed again pointed out previous theses about the need to wait for additional evidence of a sustainable decline in inflation towards the target level of 2.0%. Officials also revised forecasts regarding the rate of interest rate reduction for the current year. Three adjustments of 25 basis points each are now expected, down from the four expected in December forecasts.
Statistics on business activity in the US, published the day before, did not provide significant support to the dollar: the Services PMI from S&P Global in March decreased from 52.3 points to 51.7 points, with a forecast of 52.0 points, and the Manufacturing PMI strengthened from 52.2 points to 52.5 points, while analysts expected 51.7 points.
In turn, macroeconomic statistics put pressure on the position of the New Zealand currency: Gross Domestic Product (GDP) in the fourth quarter of 2023 decreased by 0.1% after -0.3% in the previous period, while experts expected an increase of 0.1%, and in annual terms the figure decreased by 0.3%, improving the dynamics from -0.6% with expectations at 0.1%.
Support and resistance
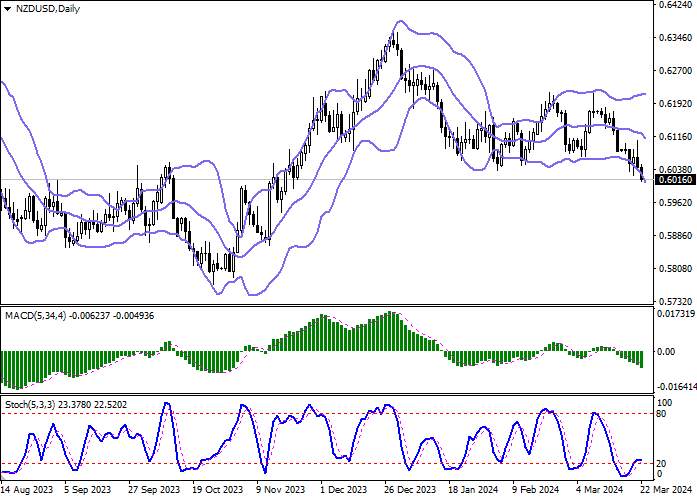
Bollinger Bands in D1 chart demonstrate a moderate decrease. The price range expands, making way to new local lows for the "bears". MACD is going down preserving a stable sell signal (located below the signal line). Stochastic, having retreated from its lows, reversed horizontally, which does not correlate well with the real dynamics in the market and the resumption of active decline at the end of this week.
Resistance levels: 0.6030, 0.6049, 0.6076, 0.6100.
Support levels: 0.6000, 0.5975, 0.5950, 0.5920.
Trading tips
Short positions may be opened after a breakdown of 0.6000 with the target at 0.5950. Stop-loss — 0.6030. Implementation time: 1-2 days.
A rebound from 0.6000 as from support followed by a breakout of 0.6030 may become a signal for opening new long positions with the target at 0.6100. Stop-loss — 0.6000.
면책 조항: 본 게시글에 표현된 견해는 전적으로 작성자의 견해이며 Followme의 공식 입장을 대변하지 않습니다. Followme는 제공된 정보의 정확성, 완전성 또는 신뢰성에 대해 책임을 지지 않으며, 서면으로 명시적으로 언급되지 않는 한 해당 내용을 기반으로 취해진 어떠한 조치에 대해서도 책임을 지지 않습니다.

더 오래된 의견은 없습니다. 소파를 가장 먼저 잡으십시오.