


| Scenario | |
|---|---|
| Timeframe | Weekly |
| Recommendation | BUY STOP |
| Entry Point | 1.0950 |
| Take Profit | 1.1060 |
| Stop Loss | 1.0900 |
| Key Levels | 1.1060, 1.0950, 1.0900, 1.0800 |
| Alternative scenario | |
|---|---|
| Recommendation | SELL STOP |
| Entry Point | 1.0900 |
| Take Profit | 1.0800 |
| Stop Loss | 1.0950 |
| Key Levels | 1.1060, 1.0950, 1.0900, 1.0800 |
Current trend
During the Asian session, the EUR/USD pair develops the “bullish” momentum formed yesterday and corrects around 1.0926 amid investors’ reaction to the results of the US Federal Reserve’s monetary policy meeting.
Today, the European investors focus on business activity in March: according to preliminary estimates, the French manufacturing PMI will increase from 47.1 points to 47.5 points, the German one – from 42.5 points to 43.1 points earlier, and the EU one could reach 47.0 points. The French service PMI is expected to adjust from 48.4 points to 48.8 points, the German one – from 48.3 points to 48.8 points, and the EU one – from 50.2 points to 50.5 points.
The American dollar is held at 102.80 in USDX: the US Fed kept interest rates at 5.25–5.50%. In an accompanying speech, the head of the regulator, Jerome Powell, noted that over the past month, the country’s economy has made significant progress. Now, the conditions for the transition to the “dovish” course are more favorable than at the beginning of the year. The forecast for the dynamics of borrowing costs was confirmed at –0.75 basis points until the end of the year, with the first adjustment in June-July, and subsequent ones in early autumn. Currently, according to the Chicago Mercantile Exchange (CME) FedWatch Instrument, the probability of a decrease in the indicator is 53.0%, while at the beginning of the week, analysts estimated it at 60.0%.
Support and resistance
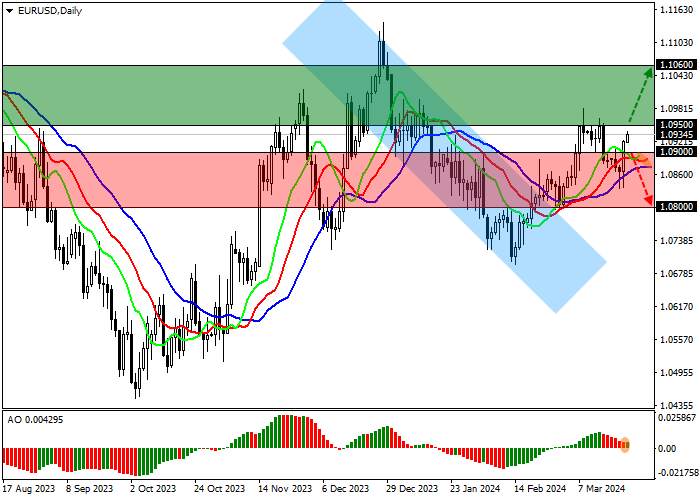
On the daily chart, the trading instrument is trying to overcome the March 8 high of 0.9600.
Technical indicators strengthen the local buy signal: fast EMAs on the Alligator indicator move away from the signal line, expanding the range of fluctuations, and the AO histogram forms ascending bars in the buy zone.
Resistance levels: 1.0950, 1.1060.
Support levels: 1.0900, 1.0800.
Trading tips
Long positions may be opened after the price rises and consolidates above 1.0950, with the target at 1.1060. Stop loss – 1.0900. Implementation period: 7 days or more.
Short positions may be opened after the price declines and consolidates below 1.0900, with the target at 1.0800. Stop loss – 1.0950.
면책 조항: 본 게시글에 표현된 견해는 전적으로 작성자의 견해이며 Followme의 공식 입장을 대변하지 않습니다. Followme는 제공된 정보의 정확성, 완전성 또는 신뢰성에 대해 책임을 지지 않으며, 서면으로 명시적으로 언급되지 않는 한 해당 내용을 기반으로 취해진 어떠한 조치에 대해서도 책임을 지지 않습니다.

더 오래된 의견은 없습니다. 소파를 가장 먼저 잡으십시오.