
| Scenario | |
|---|---|
| Timeframe | Intraday |
| Recommendation | SELL |
| Entry Point | 0.6100 |
| Take Profit | 0.6049 |
| Stop Loss | 0.6130 |
| Key Levels | 0.6030, 0.6049, 0.6076, 0.6100, 0.6130, 0.6158, 0.6183, 0.6200 |
| Alternative scenario | |
|---|---|
| Recommendation | BUY STOP |
| Entry Point | 0.6130 |
| Take Profit | 0.6183 |
| Stop Loss | 0.6100 |
| Key Levels | 0.6030, 0.6049, 0.6076, 0.6100, 0.6130, 0.6158, 0.6183, 0.6200 |
Current trend
The NZD/USD pair is declining, developing a fairly active "bearish" trend formed during the week, as well as updating local lows of March 6. The instrument is testing the strong support level of 0.6100, and the "bulls" almost completely ignore macroeconomic statistics from New Zealand. The Manufacturing PMI in February rose from 47.5 points (revised from 47.3 points) to 49.3 points, which turned out to be significantly better than forecasts.
Meanwhile, data on producer inflation in the US, published the day before, puts pressure on quotes. The Producer Price Index in February accelerated from 0.3% to 0.6%, while analysts expected the previous dynamics to continue, and in annual terms the indicator increased from 1.0% to 1.6%, with a forecast of 1.1%. Against this background, doubts regarding the likelihood of a US Federal Reserve interest rate cut in June have strengthened, although such a scenario is still considered as the main one.
The day before, investors also paid attention to the publication of statistics on the American labor market. Initial Jobless Claims for the week ended March 8 decreased from 210.0 thousand to 209.0 thousand, while analysts expected 218.0 thousand, and Continuing Jobless Claims for the week ended March 1 increased from 1.794 million to 1.811 million against expectations of 1.900 million. Thus, the labor market has again demonstrated its stability, which does not contribute to the correction of monetary policy.
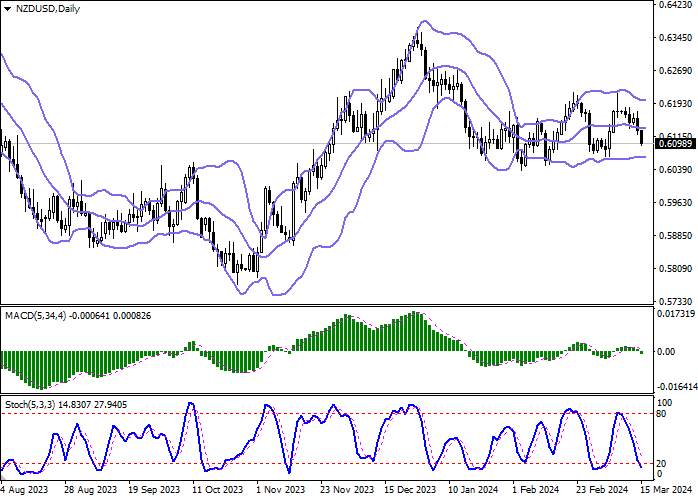
Support and resistance
In the D1 chart, Bollinger Bands are reversing horizontally. The price range is changing slightly, but remains rather spacious for the current level of activity in the market. MACD is falling, keeping a relatively strong sell signal (the histogram is below the signal line). The indicator is trying to consolidate below the zero level. Stochastic is showing similar dynamics; however, the indicator line is rapidly approaching its lows, indicating the risks of oversold New Zealand dollar in the ultra-short term.
Resistance levels: 0.6130, 0.6158, 0.6183, 0.6200.
Support levels: 0.6100, 0.6076, 0.6049, 0.6030.
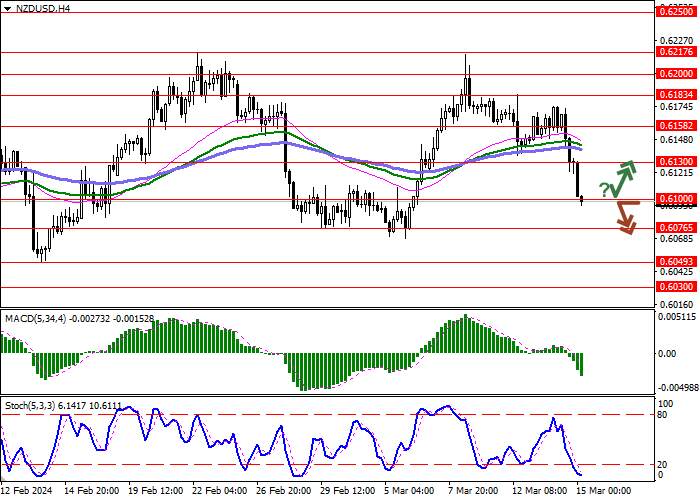
Trading tips
Short positions may be opened after a breakdown of 0.6100 with the target at 0.6049. Stop-loss — 0.6130. Implementation time: 1-2 days.
A rebound from 0.6100 as from support followed by a breakout of 0.6130 may become a signal for opening new long positions with the target at 0.6183. Stop-loss — 0.6100.
면책 조항: 본 게시글에 표현된 견해는 전적으로 작성자의 견해이며 Followme의 공식 입장을 대변하지 않습니다. Followme는 제공된 정보의 정확성, 완전성 또는 신뢰성에 대해 책임을 지지 않으며, 서면으로 명시적으로 언급되지 않는 한 해당 내용을 기반으로 취해진 어떠한 조치에 대해서도 책임을 지지 않습니다.

더 오래된 의견은 없습니다. 소파를 가장 먼저 잡으십시오.