


| Scenario | |
|---|---|
| Timeframe | Intraday |
| Recommendation | BUY STOP |
| Entry Point | 103.00 |
| Take Profit | 103.60 |
| Stop Loss | 102.70 |
| Key Levels | 102.00, 102.23, 102.45, 102.75, 103.00, 103.30, 103.60, 103.95 |
| Alternative scenario | |
|---|---|
| Recommendation | SELL STOP |
| Entry Point | 102.75 |
| Take Profit | 102.23 |
| Stop Loss | 103.00 |
| Key Levels | 102.00, 102.23, 102.45, 102.75, 103.00, 103.30, 103.60, 103.95 |
Current trend
USDX shows slight growth, developing the "bullish" momentum formed at the end of last week, when the instrument managed to retreat from the local lows of January 15. The instrument is testing 102.90 for a breakout, while analysts expect new drivers to emerge.
The index is significantly supported by inflation data published yesterday in the United States: in February, the Consumer Price Index adjusted from 3.1% to 3.2% in annual terms, while analysts expected neutral dynamics, and in monthly terms the indicator accelerated from 0.3% to 0.4%. Core CPI excluding Food and Energy, added 0.4% month-on-month and 3.8% year-on-year, which turned out to be higher than expert estimates of 0.3% and 3.7%, respectively. More sustained price pressure may cause another revision of forecasts regarding the rate of possible reduction in the cost of borrowing by the US Federal Reserve this year. Markets are now pricing in at least three 25 basis point interest rate adjustments, the first of which could come in June.
Tomorrow at 14:30 (GMT 2) February statistics on producer inflation will be published in the United States: it is predicted that the Producer Price Index on a monthly basis will be fixed at 0.3%, and on an annual basis it will increase from 0.9% to 1.2%, while the Core PPI annual rate will remain at 2.0% and the monthly rate will drop from 0.5% to 0.2%. In turn, Retail Sales could rise from −0.8% to 0.8%, and the indicator excluding autos could increase from −0.6% to 0.5%.
Support and resistance
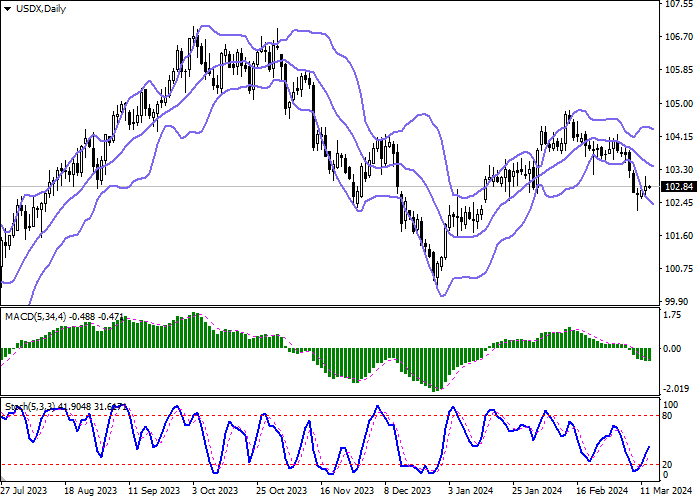
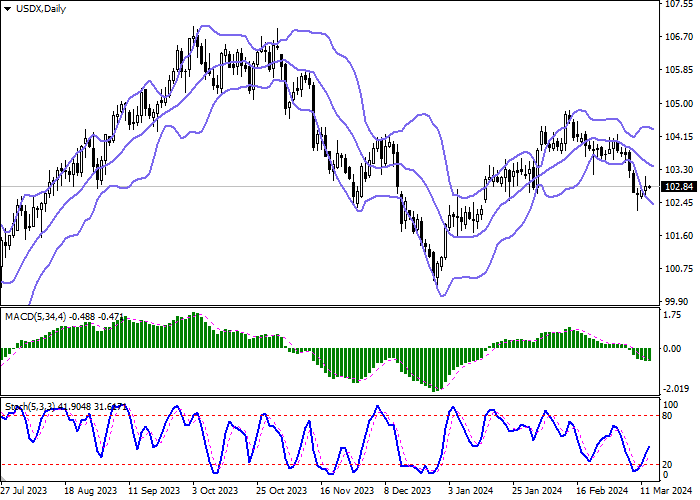
Bollinger Bands in D1 chart demonstrate quite active decrease. The price range expands from below, making way for new local lows for the "bears". MACD is falling, keeping a relatively strong sell signal (the histogram is below the signal line). Stochastic, on the contrary, has reversed into an upward plane and is currently actively signaling in favor of the development of corrective growth in the near future.
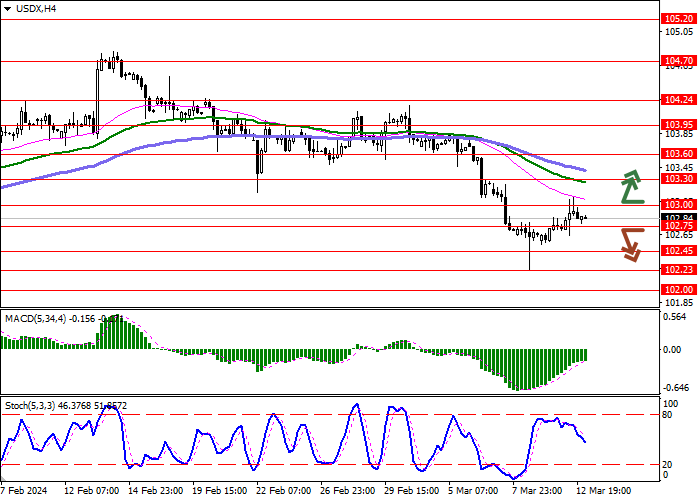
Resistance levels: 103.00, 103.30, 103.60, 103.95.
Support levels: 102.75, 102.45, 102.23, 102.00.
Trading tips
Long positions can be opened after a breakout of 103.00 with the target of 103.60. Stop-loss — 102.70. Implementation time: 2-3 days.
The return of a "bearish" trend with the breakdown of 102.75 may become a signal for new short positions with the target at 102.23. Stop-loss — 103.00.
면책 조항: 본 게시글에 표현된 견해는 전적으로 작성자의 견해이며 Followme의 공식 입장을 대변하지 않습니다. Followme는 제공된 정보의 정확성, 완전성 또는 신뢰성에 대해 책임을 지지 않으며, 서면으로 명시적으로 언급되지 않는 한 해당 내용을 기반으로 취해진 어떠한 조치에 대해서도 책임을 지지 않습니다.

