Hello everyone. In today’s article, we will look at the past performance of the 4H Hour Elliott Wave chart of Alphabet Inc. ($GOOGL). The rally from 10.27.2023 low at $120.25 unfolded as 5 waves impulse. So, we expected the pullback to unfold in 3 swings and find buyers again. We will explain the structure & forecast below:
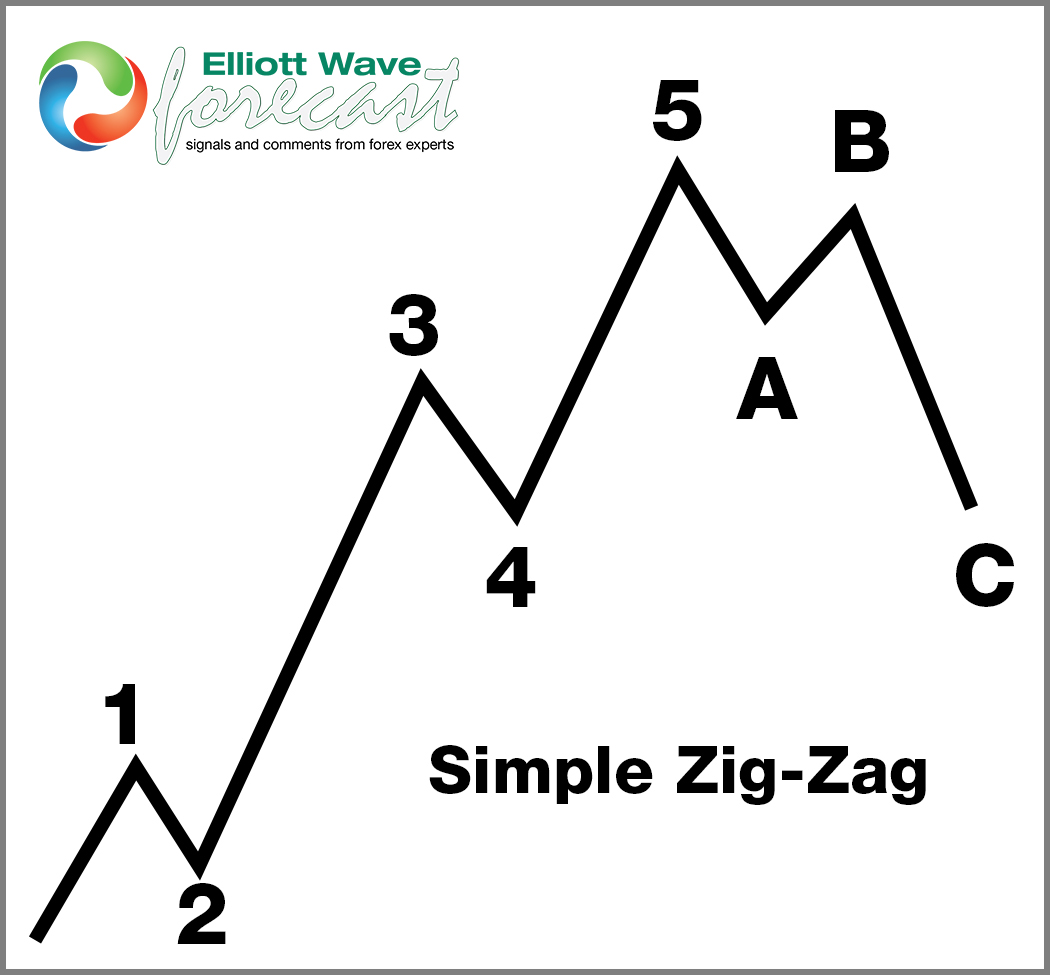
5 Wave Impulse Structure + ABC correction
$GOOGL 4H Elliott Wave Chart 2.29.2024:
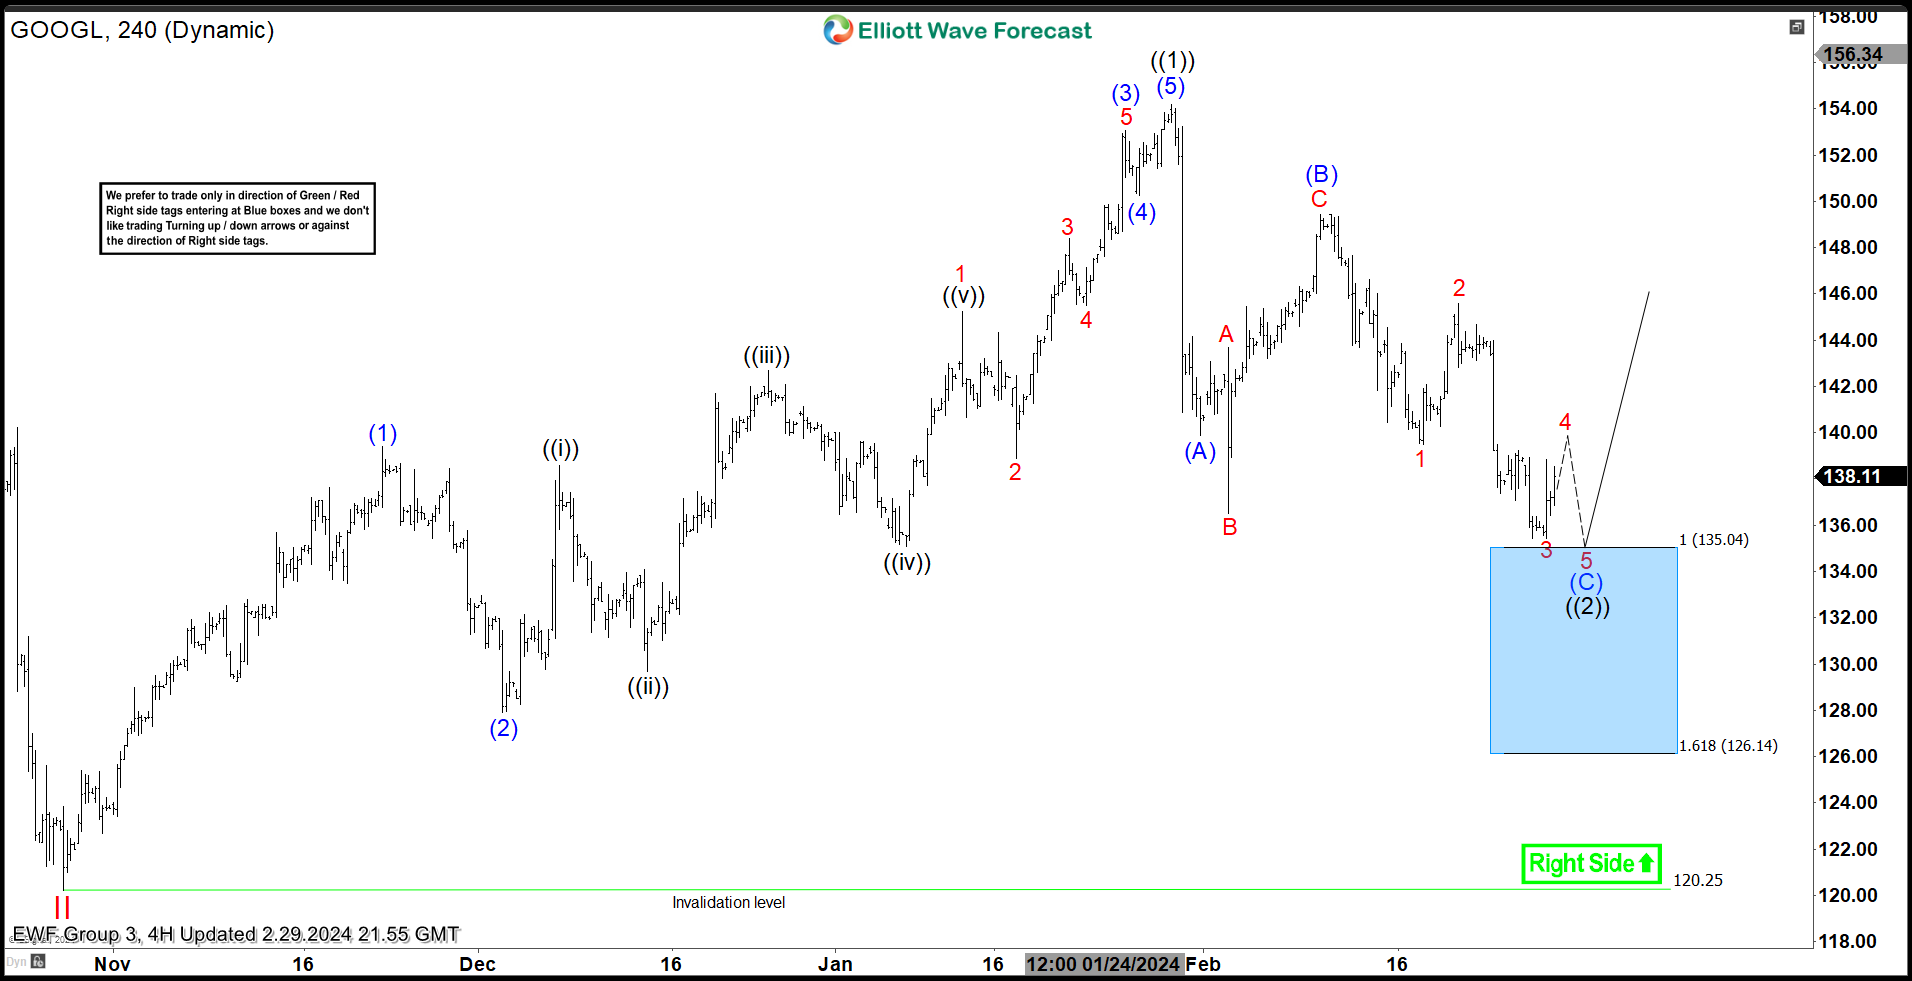 Here is the 4H Elliott Wave count from 2.29.2024. We expected the pullback to find buyers at the blue box area at 135.04 – 126.14 in 3 swings.
$GOOGL 4H Elliott Wave Chart 3.11.2024:
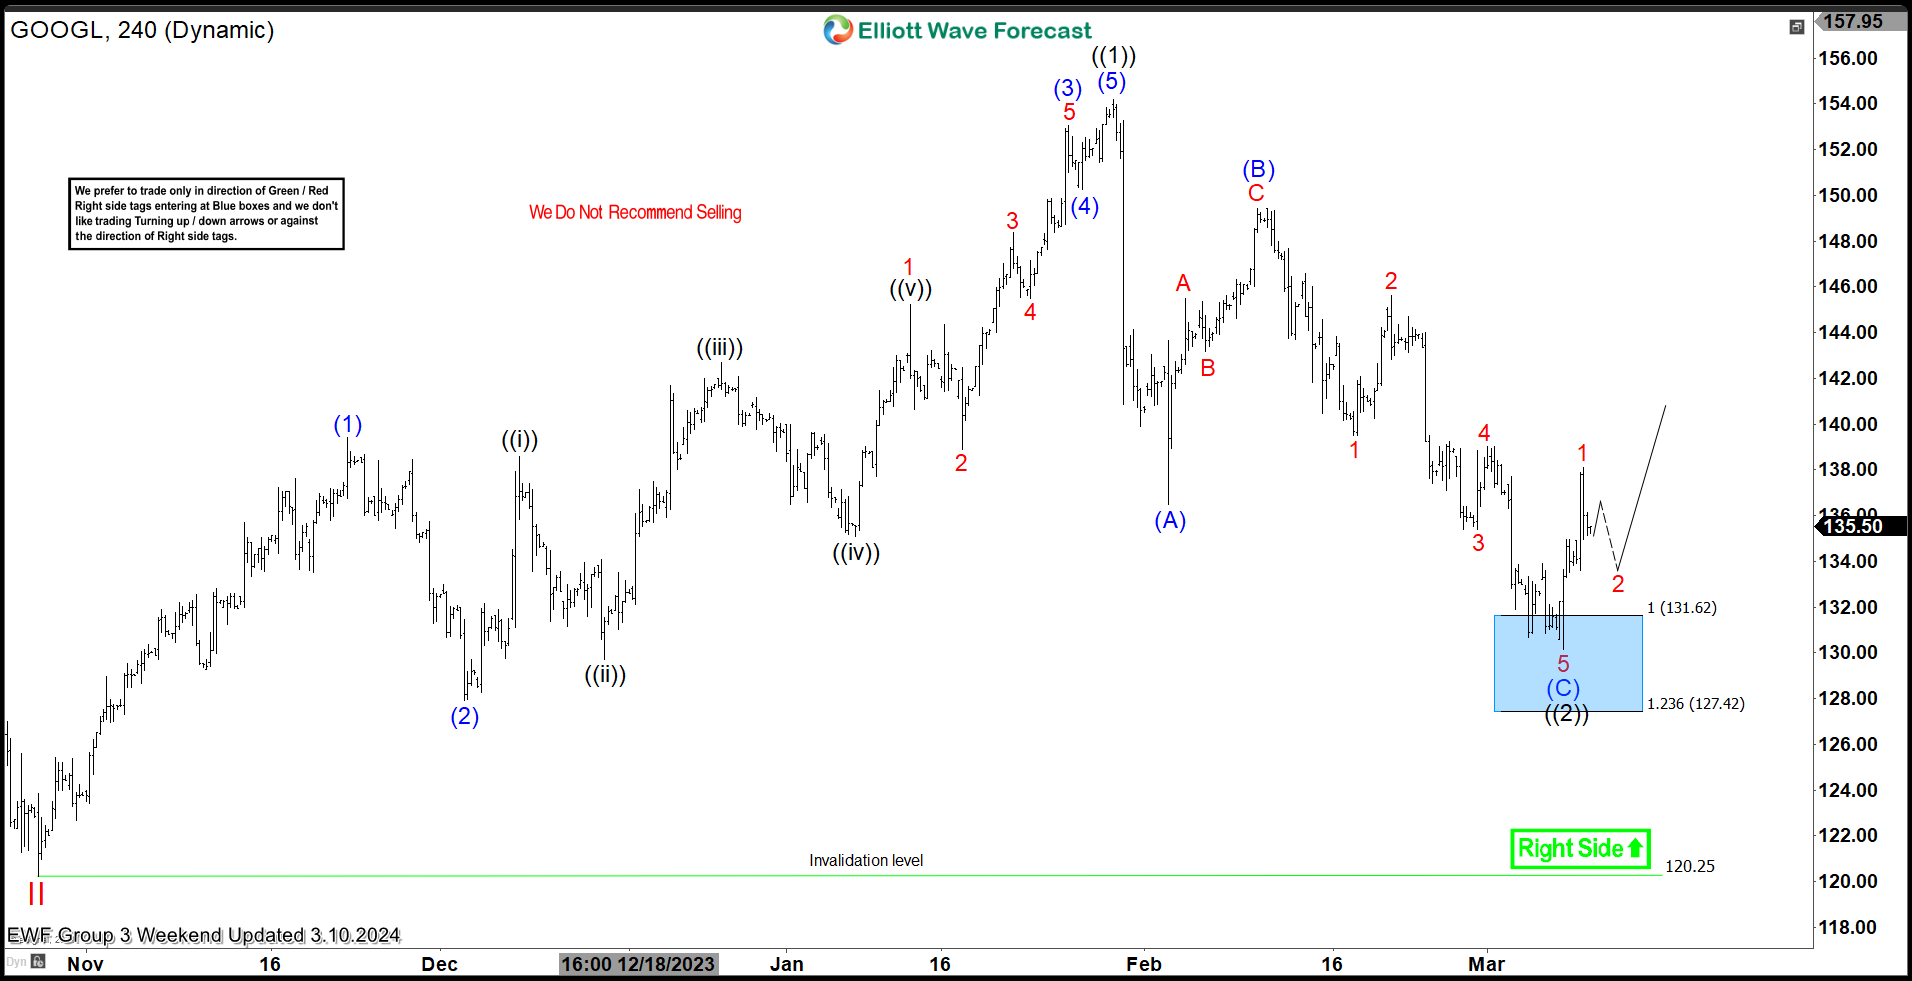 Here is the latest 4H update from 3.10.2024 showing the bounce taking place as expected. The stock has reacted higher from the blue box area ending the 3 swings decline. The stock is expected to remain supported towards $142 – 145 where longs will be able to get risk free. A break above 1.29.2024 peak at 153.78 will open the next leg higher towards $164 - 185.
면책 조항: 본 게시글에 표현된 견해는 전적으로 작성자의 견해이며 Followme의 공식 입장을 대변하지 않습니다. Followme는 제공된 정보의 정확성, 완전성 또는 신뢰성에 대해 책임을 지지 않으며, 서면으로 명시적으로 언급되지 않는 한 해당 내용을 기반으로 취해진 어떠한 조치에 대해서도 책임을 지지 않습니다.

더 오래된 의견은 없습니다. 소파를 가장 먼저 잡으십시오.