Hello everyone. In today’s article, we will look at the past performance of the 1 Hour Elliott Wave chart of Consumer Staples Select Sector ($XLP). The rally from 2.14.2024 low at $72.36 unfolded as 5 waves impulse. So, we expected the pullback to unfold in 3 swings and find buyers again. We will explain the structure & forecast below:
$XLP 1H Elliott Wave Chart 3.01.2024:
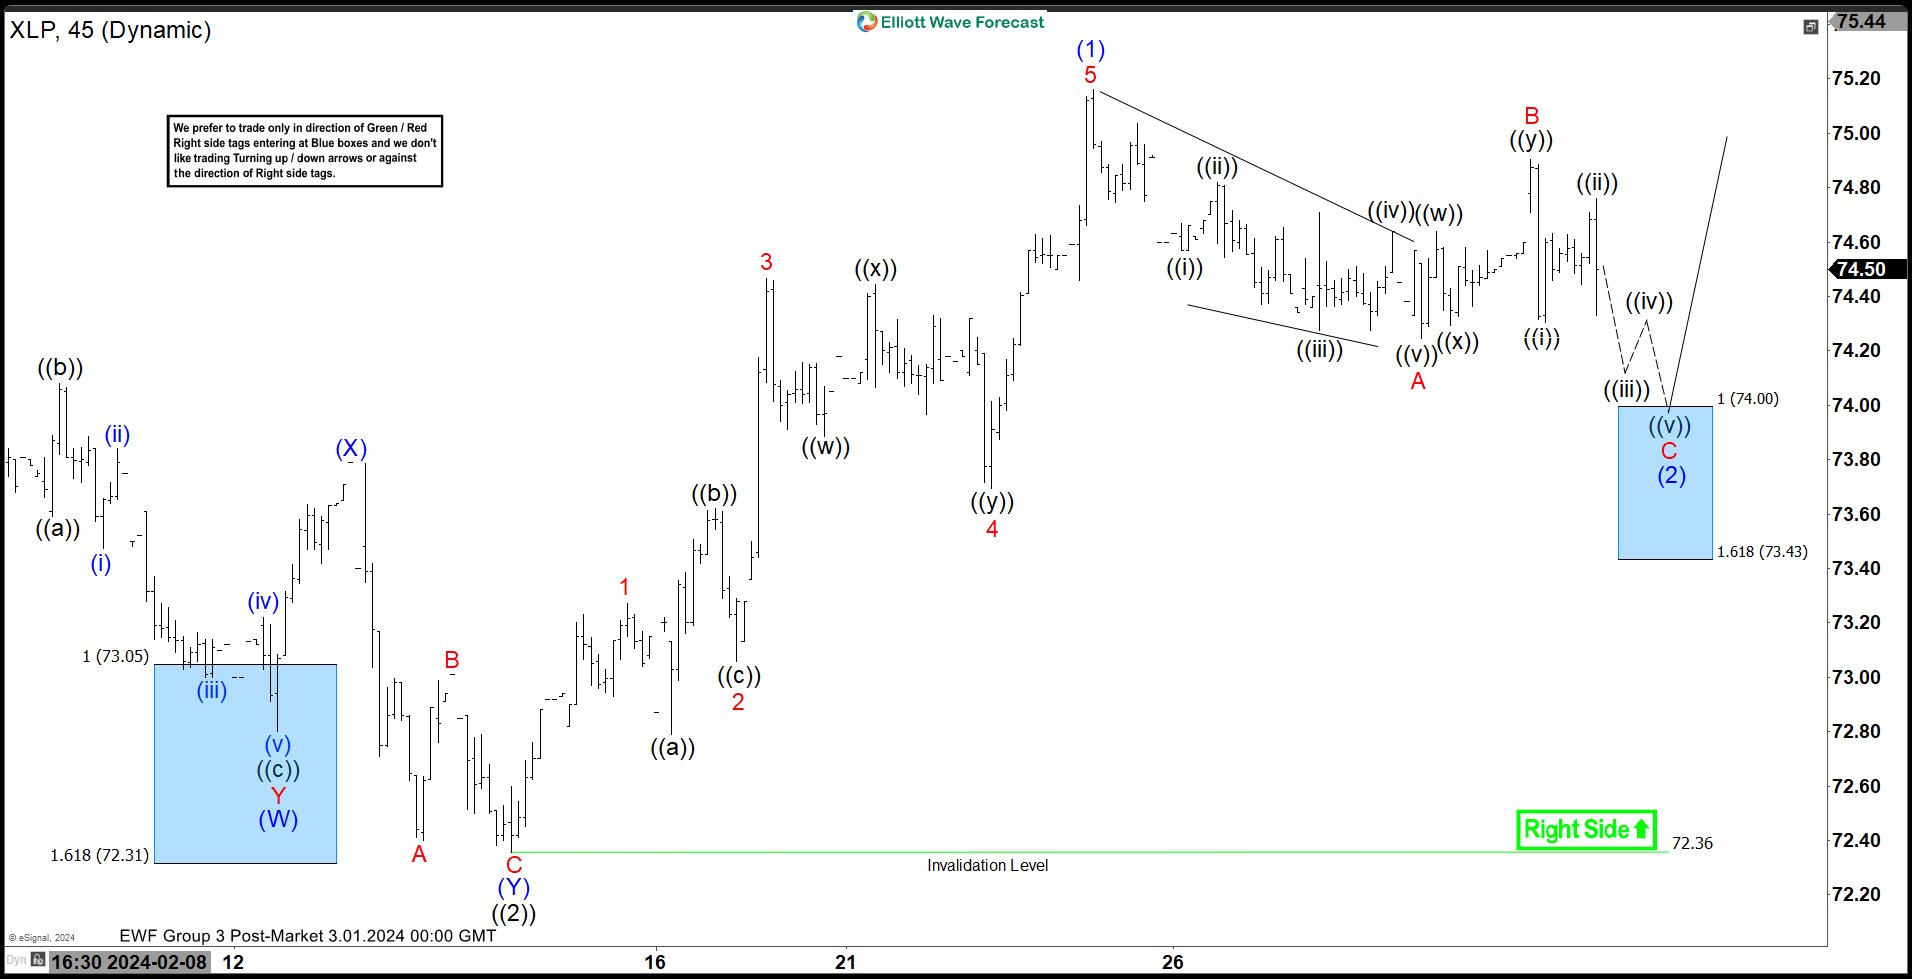 Here is the 1H Elliott Wave count from 3.01.2024. We expected the pullback to find buyers at the blue box area at 74.00 – 73.43 in 3 swings.
$XLP 1H Elliott Wave Chart 3.03.2024:
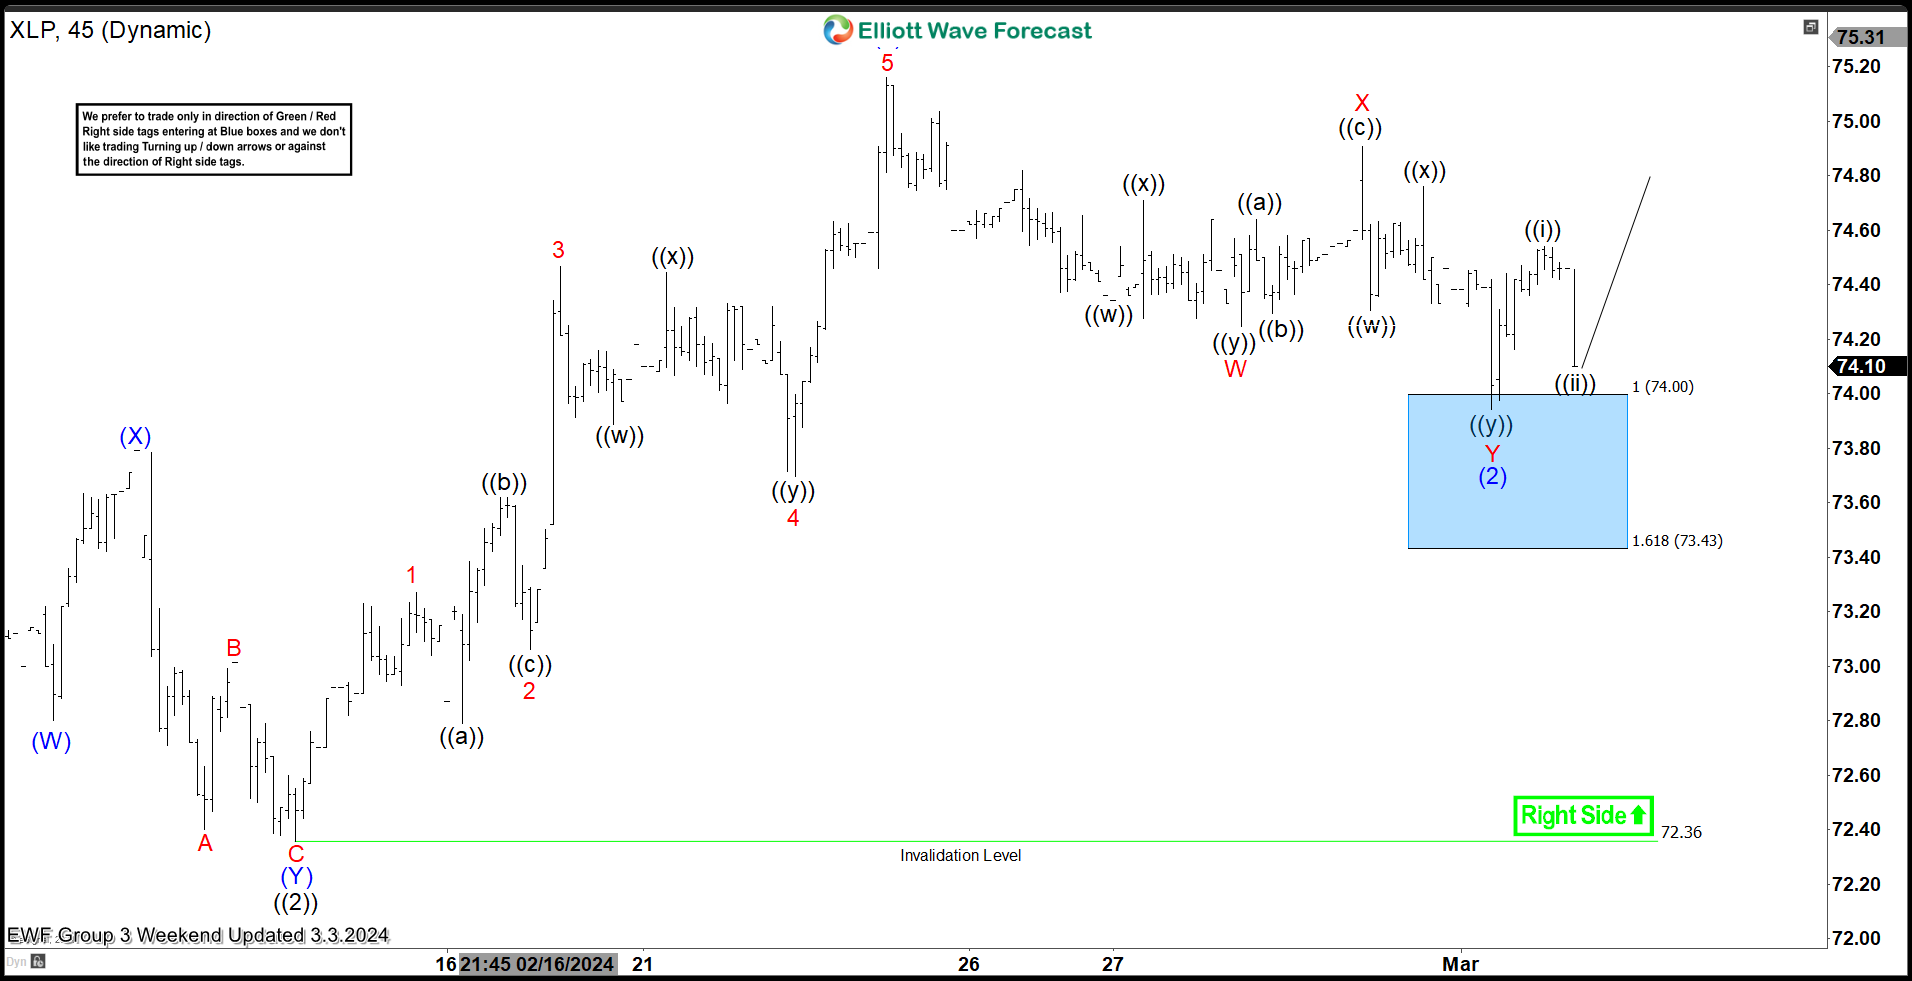 Here is the 1H update few days later from 3.03.2024 showing the bounce taking place as expected. The ETF reacted higher from the blue box area after 3 swings allowing longs to get a risk free position. The ETF is expected to remain supported towards $76 – 78 before another pullback can happen.
면책 조항: 본 게시글에 표현된 견해는 전적으로 작성자의 견해이며 Followme의 공식 입장을 대변하지 않습니다. Followme는 제공된 정보의 정확성, 완전성 또는 신뢰성에 대해 책임을 지지 않으며, 서면으로 명시적으로 언급되지 않는 한 해당 내용을 기반으로 취해진 어떠한 조치에 대해서도 책임을 지지 않습니다.

더 오래된 의견은 없습니다. 소파를 가장 먼저 잡으십시오.