


Beyond Meat Inc (NASDAQ: BYND) is the first plant-based meat analogue company to go public. However, after an impressive 250% rally from the 2019 IPO, the stock suffered a 97% loss of it's value within a span of 5 years in decline. The recent surge in price put the spotlight again on the stock so let's dive into the technical chart based on the Elliott Wave Theory.
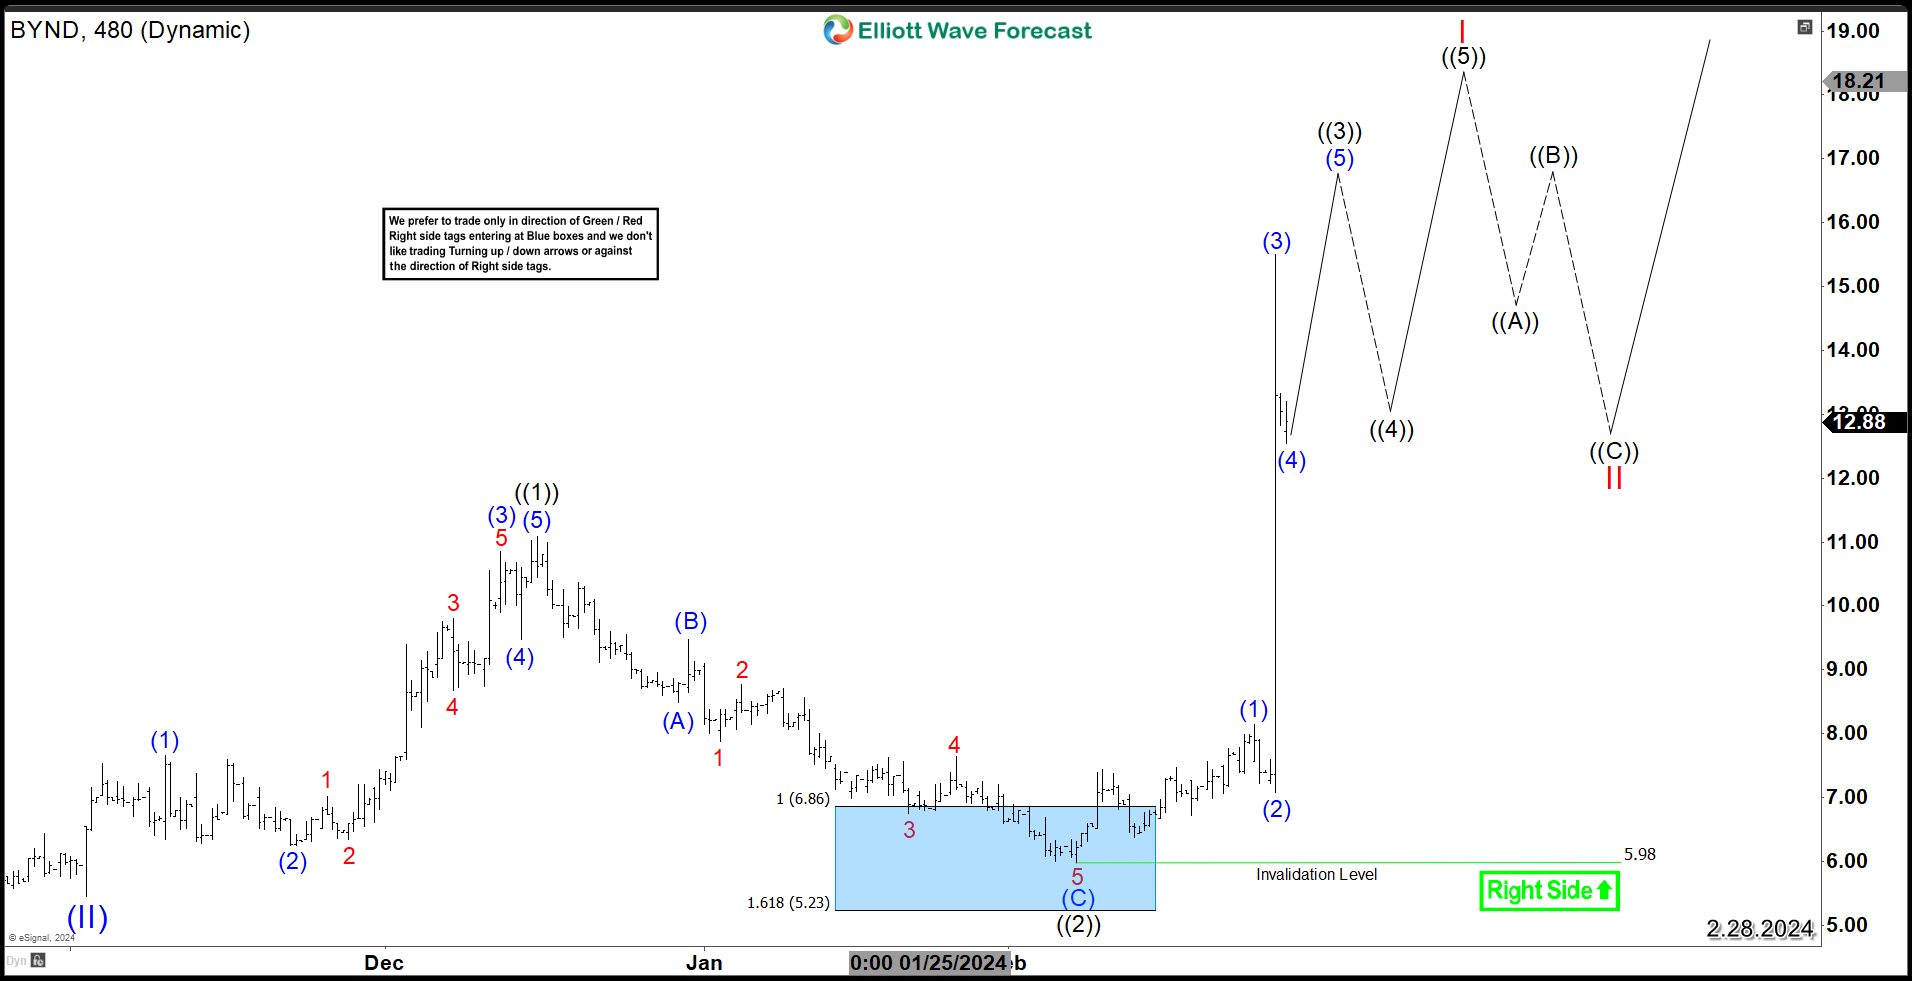
The initial rally from November 2023 unfolded as a 5 waves advance in wave ((1)) then it was followed by a technical 3 waves Zigzag structure in wave ((2)). As you can see in the following chart, the decline in wave ((2)) reached the blue box at equal legs area $6.86 - $5.23 from where it started the next rally in wave ((3)). The blue boxe in our chart is a High-frequency area where the market is likely to end cycles and make a turn.
The strong rally taking place is proposed to be wave (3) of ((3)) and therefore BYND is still expected to see at least 2 more swings to the upside before ending wave I within a regular impulsive 5 waves advance. The impulsive nature of the current advance ,which reached the 1.618 Fibonacci extension at $15.1, will support the stock during pullbacks in 3 , 7 or 11 swings until it ends the cycle from 2023 low ($5.45).
In conclusion, BYND is in the process of creating an impulsive reversal within the daily cycle which could lead to a long term shift of trend to the upside if the stock sees a followup to the current rally within the rest of this year.
BYND 8 Hour Chart 2.28.2024
면책 조항: 본 게시글에 표현된 견해는 전적으로 작성자의 견해이며 Followme의 공식 입장을 대변하지 않습니다. Followme는 제공된 정보의 정확성, 완전성 또는 신뢰성에 대해 책임을 지지 않으며, 서면으로 명시적으로 언급되지 않는 한 해당 내용을 기반으로 취해진 어떠한 조치에 대해서도 책임을 지지 않습니다.

