


| Scenario | |
|---|---|
| Timeframe | Weekly |
| Recommendation | BUY STOP |
| Entry Point | 53200.00 |
| Take Profit | 56250.00 |
| Stop Loss | 51500.00 |
| Key Levels | 46875.00, 48437.50, 50000.00, 53125.00, 56250.00 |
| Alternative scenario | |
|---|---|
| Recommendation | SELL STOP |
| Entry Point | 49980.00 |
| Take Profit | 48437.50, 46875.00 |
| Stop Loss | 51000.00 |
| Key Levels | 46875.00, 48437.50, 50000.00, 53125.00, 56250.00 |
Current trend
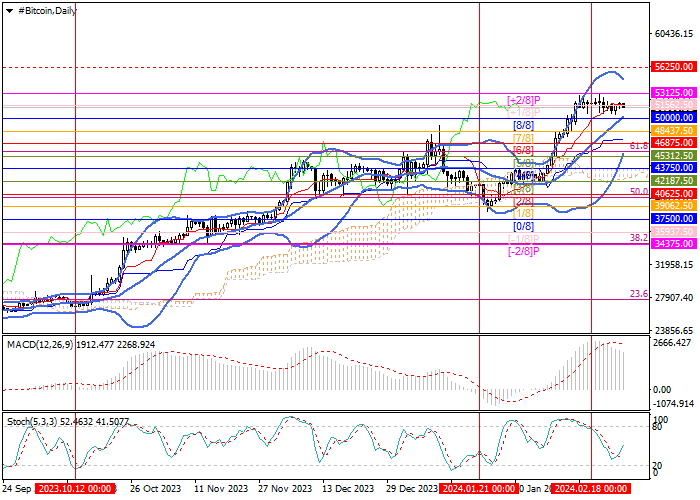
Last week, the BTC/USD pair, after an active four-week growth, stabilized at 52000.00, where it continues to trade currently. Nevertheless, the fundamental positive factors for the market remain, which may lead to a resumption of upward dynamics.
The increase in investment in bitcoin ETFs continues, although the pace slowed down slightly last week: according to BitMEX Research, from February 20 to February 23, it amounted to only 0.65 billion dollars, which is significantly less than the 2.2 billion dollars recorded from February 12 to February 16. Nevertheless, according to the statistics of the Block, Robinhood, and Coinbase platforms, interest in digital currencies is increasing. At the same time, large miners continue to hold their BTC in anticipation of the next halving of the network, which will take place in April. This stimulates the creation of a shortage in the market, acting as a catalyst for strengthening the upward dynamics of quotes of both the world's first cryptocurrency and altcoins.
The strengthening of prices for digital assets is also constrained by the likelihood of postponing the start of monetary easing by the US Federal Reserve to the second half of the year due to the acceleration of inflation.
Support and resistance
Technically, the price forms a lateral range of 53125.00–50000.00 (Murrey level [ 2/8]–[8/8]), the breakdown of the upper border of which will allow the quotes to continue growing to the level of 56250.00 (Murrey level [ 1/8], W1). The key for the "bears" is the 50000.00 mark, supported by the central line of Bollinger Bands; after consolidation below it an attempt to change the trend and further decrease the instrument to the levels of 48437.50 (Murrey level [7/8]) and 46875.00 (Murrey level [6/8]) may occur, but so far this scenario seems less likely.
Technical indicators show continued growth: Bollinger Bands and Stochastic are reversing up, MACD is decreasing, but remains in a positive zone.
Resistance levels: 53125.00, 56250.00.
Support levels: 50000.00, 48437.50, 46875.00.
Trading tips
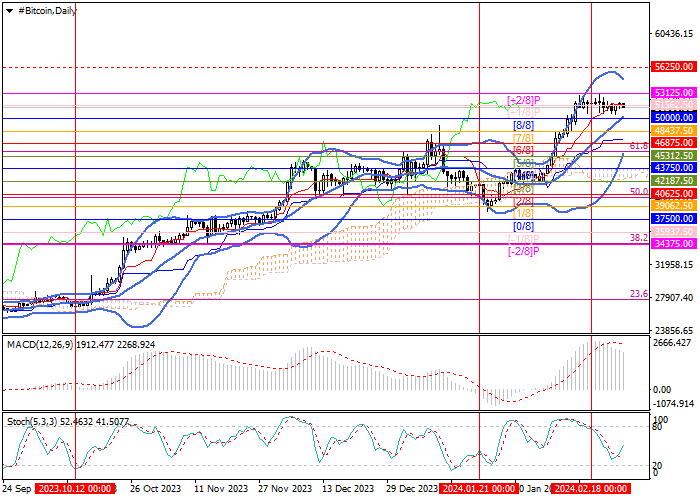
Long positions can be opened above 53125.00 with the target of 56250.00 and stop-loss around 51500.00. Implementation period: 5–7 days.
Short positions should be opened below the 50000.00 mark with targets of 48437.50, 46875
면책 조항: 본 게시글에 표현된 견해는 전적으로 작성자의 견해이며 Followme의 공식 입장을 대변하지 않습니다. Followme는 제공된 정보의 정확성, 완전성 또는 신뢰성에 대해 책임을 지지 않으며, 서면으로 명시적으로 언급되지 않는 한 해당 내용을 기반으로 취해진 어떠한 조치에 대해서도 책임을 지지 않습니다.

