Hello Traders. In today’s article, we are going to follow up on AbbVie Inc. ($ABBV) forecast that was posted back in July 2023 and take a look at the latest count.
$ABBV Daily Elliott Wave View July 2023:
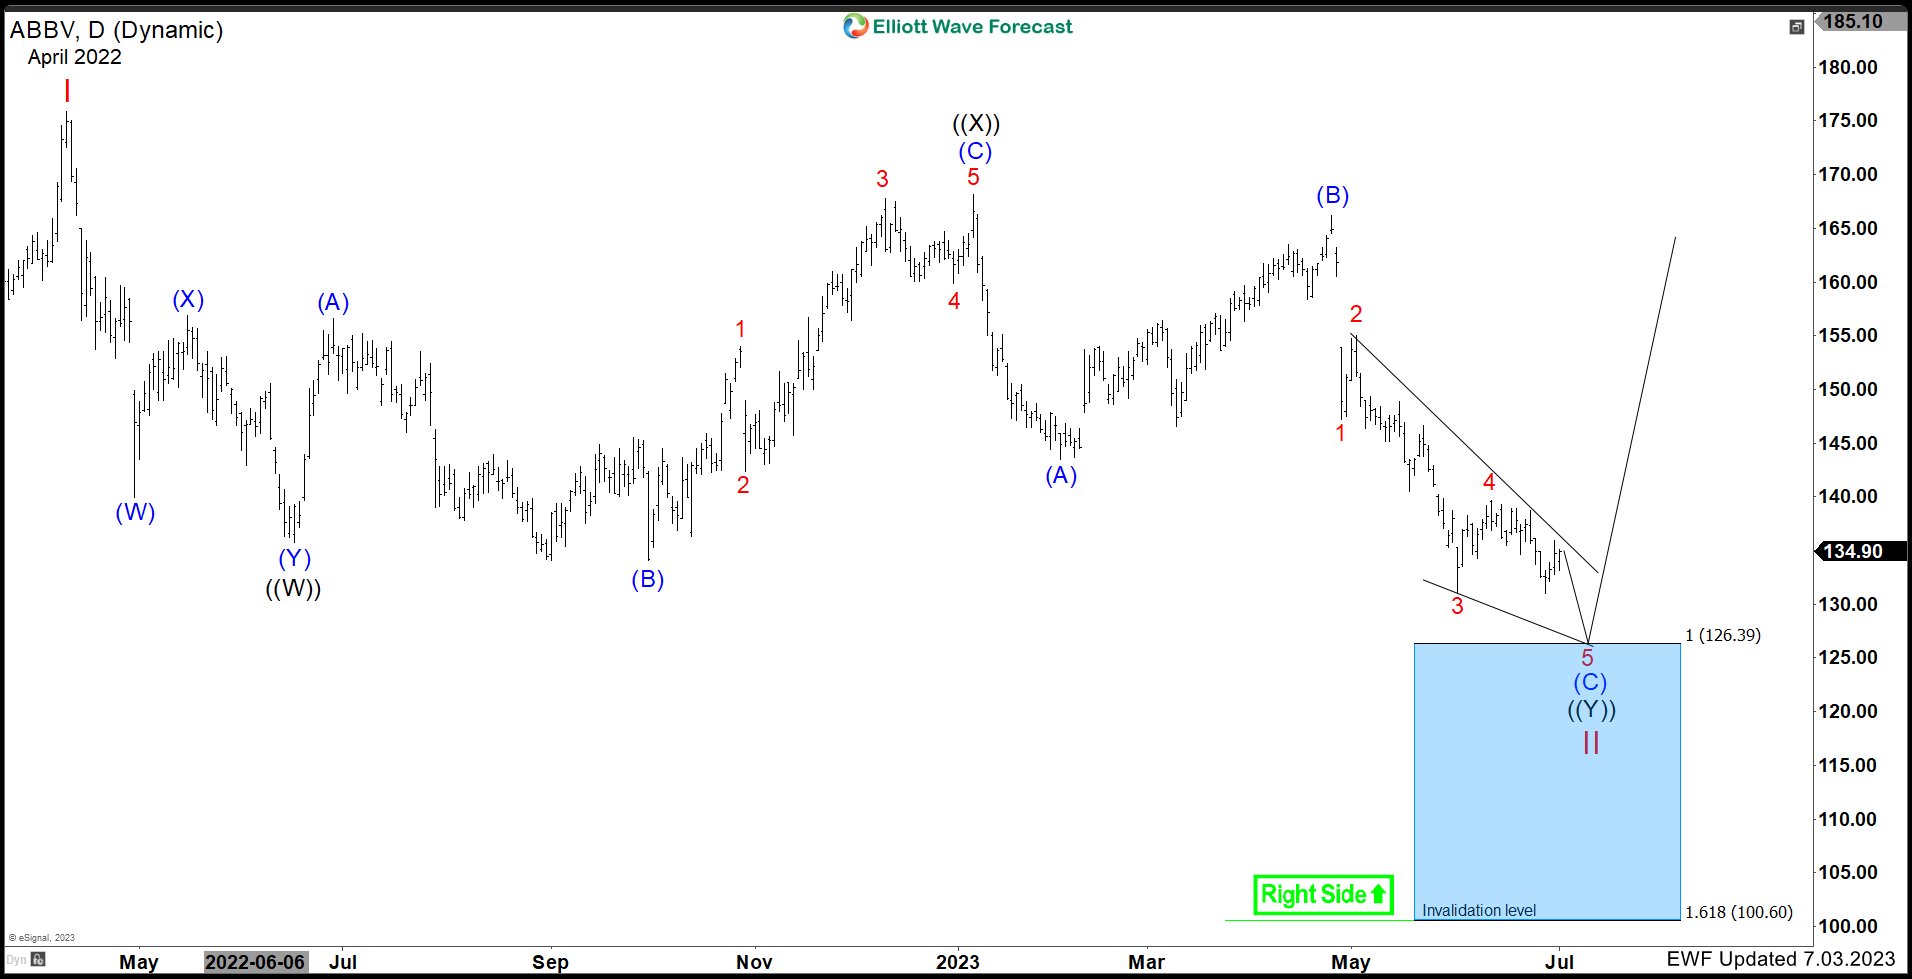
Our remarks from July 2023 were as follows:
"The Daily chart above shows the cycle from April 2022 peak unfold in a double three (WXY) corrective structure. The stock should be at the tail end of the correction towards the Blue Box area at $126.39 – 100.60 where buyers are expected to appear and start the next cycle higher. Although, we like it lower right now towards the blue box, traders should not be short selling the last swing lower as truncations can happen at this stage of the market."
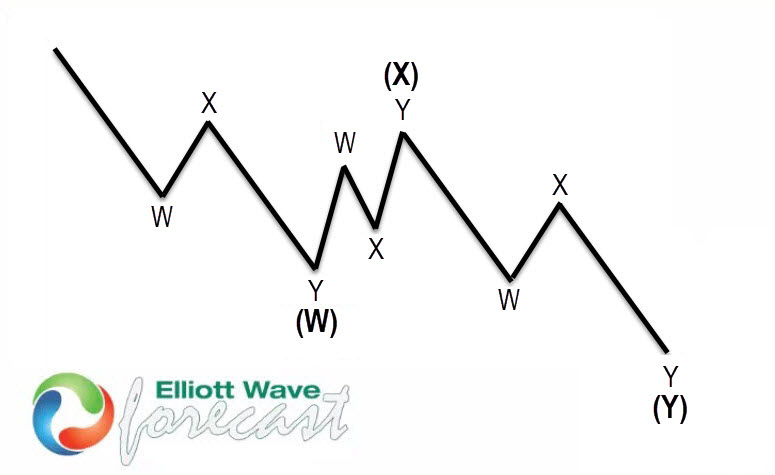
Double Three (WXY) Corrective Structure
$ABBV Latest Elliott Wave View Feb 2024:
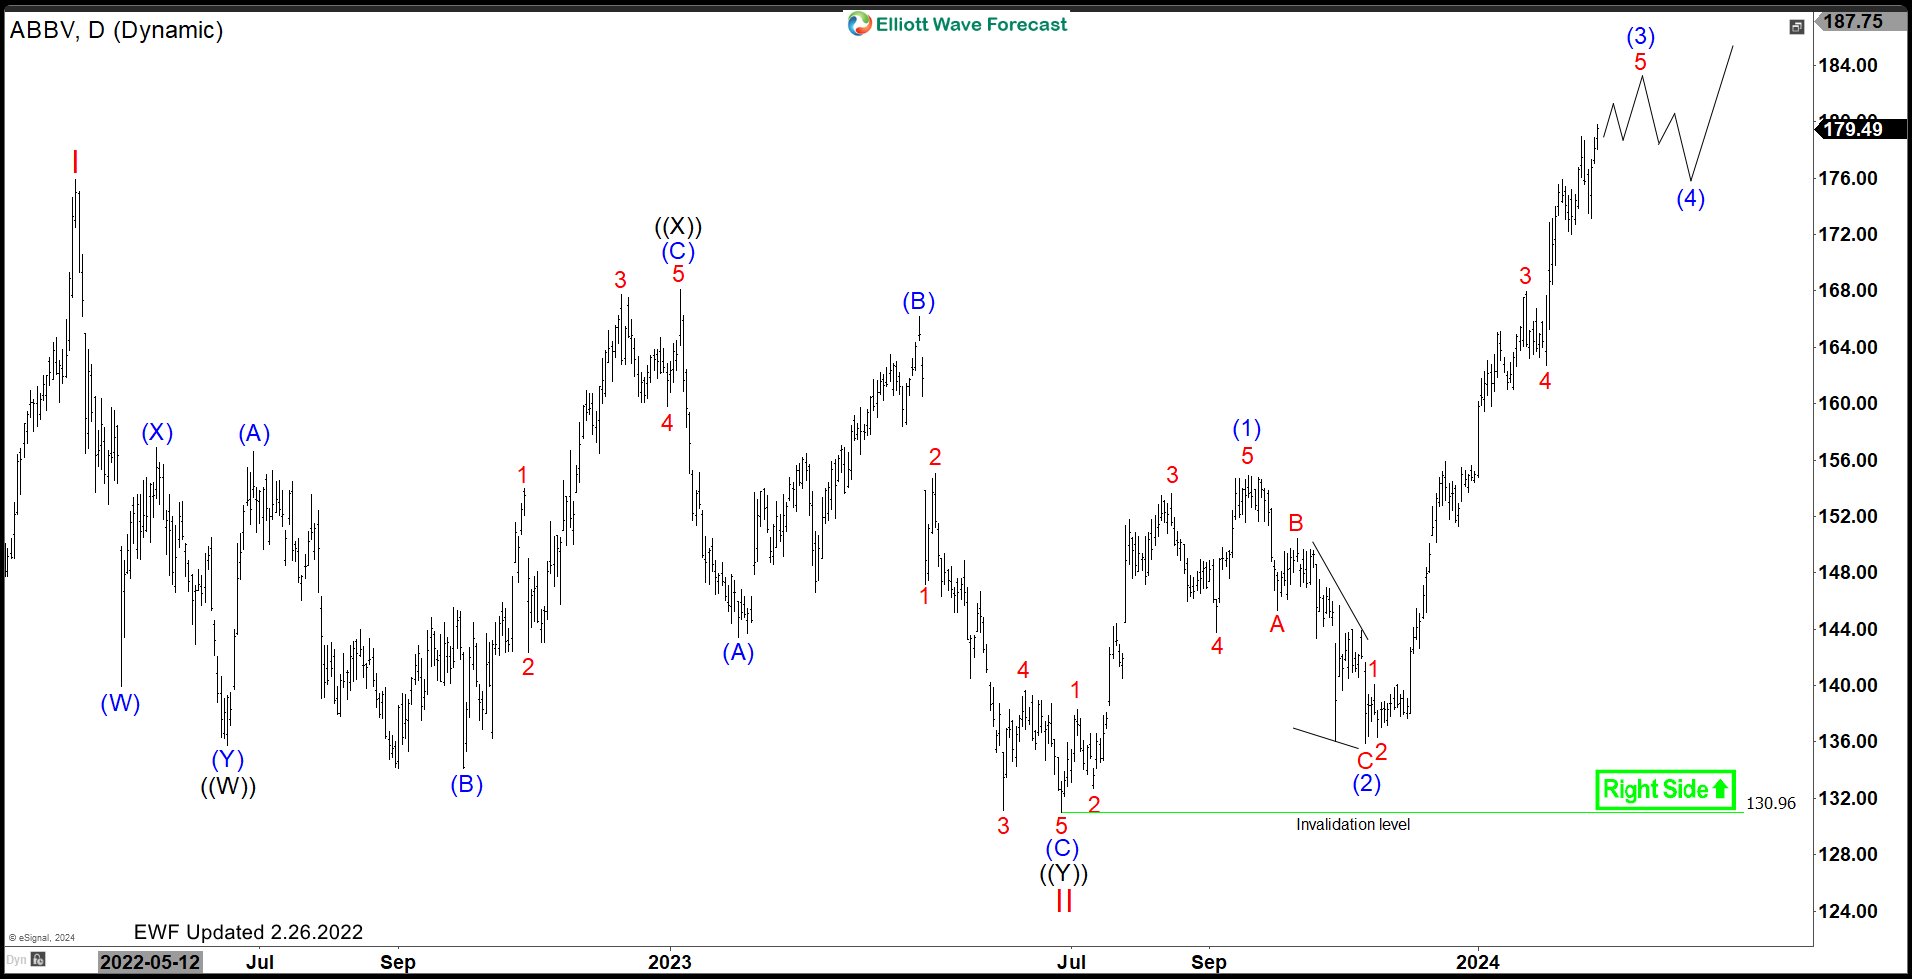 The Daily Chart above shows the latest view which ended up seeing the correction end with a truncation before reaching the blue box area. The stock rallied in a 5 wave impulse after finding buyers on 6.28.2023 at $130.96. Once the 5 wave advance ended, a 3 swing pullback (ABC) took place to correct it and was met with buyers. The strong reaction from there has made new ATHs and erased divergence in all timeframes making it the wave 3 of 3 of a nest. The stock is expected to remain supported in a series of 4s and 5s with a target higher towards $186 – 204 before the cycle from June 2023 low ends. Once that cycle ends, we expect the pullback to correct June 2022 to also find buyers again in 3 or 7 swings in the future.
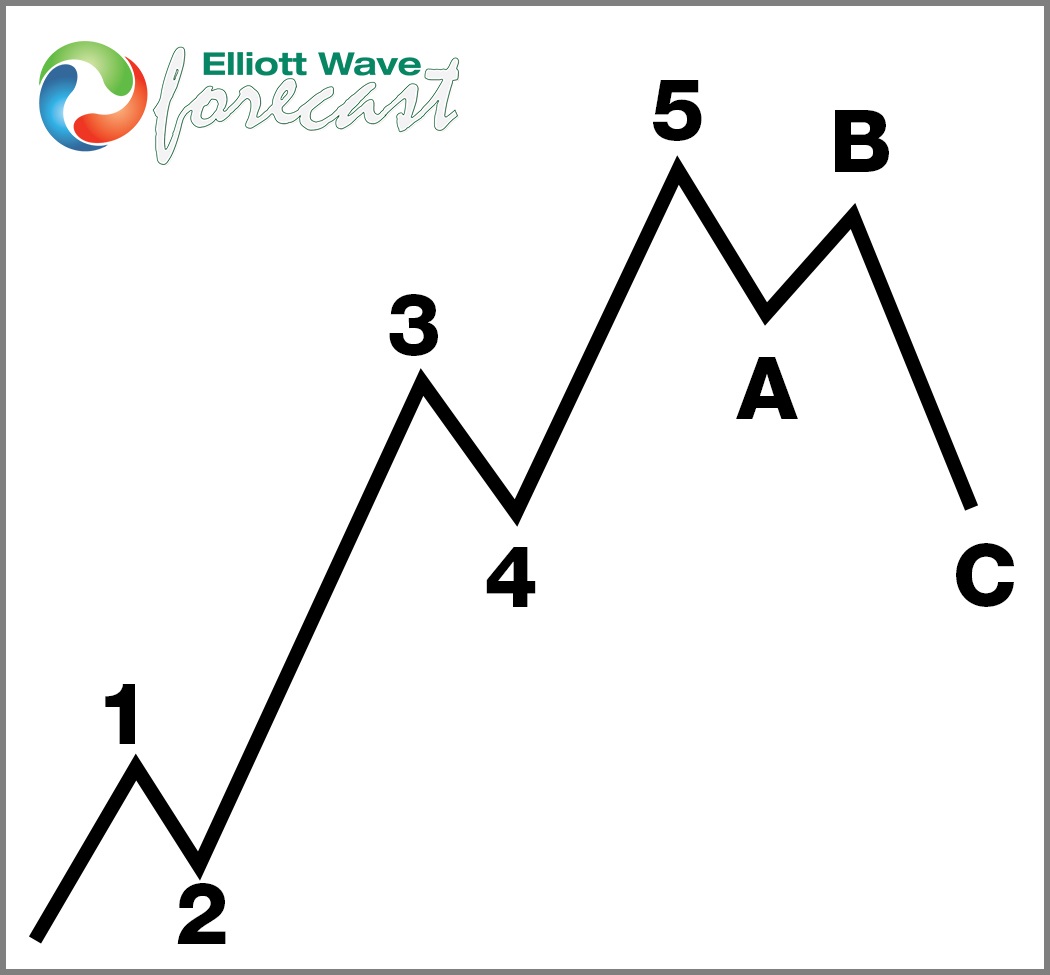
5 Wave Impulse Structure + ABC correction
면책 조항: 본 게시글에 표현된 견해는 전적으로 작성자의 견해이며 Followme의 공식 입장을 대변하지 않습니다. Followme는 제공된 정보의 정확성, 완전성 또는 신뢰성에 대해 책임을 지지 않으며, 서면으로 명시적으로 언급되지 않는 한 해당 내용을 기반으로 취해진 어떠한 조치에 대해서도 책임을 지지 않습니다.

더 오래된 의견은 없습니다. 소파를 가장 먼저 잡으십시오.