


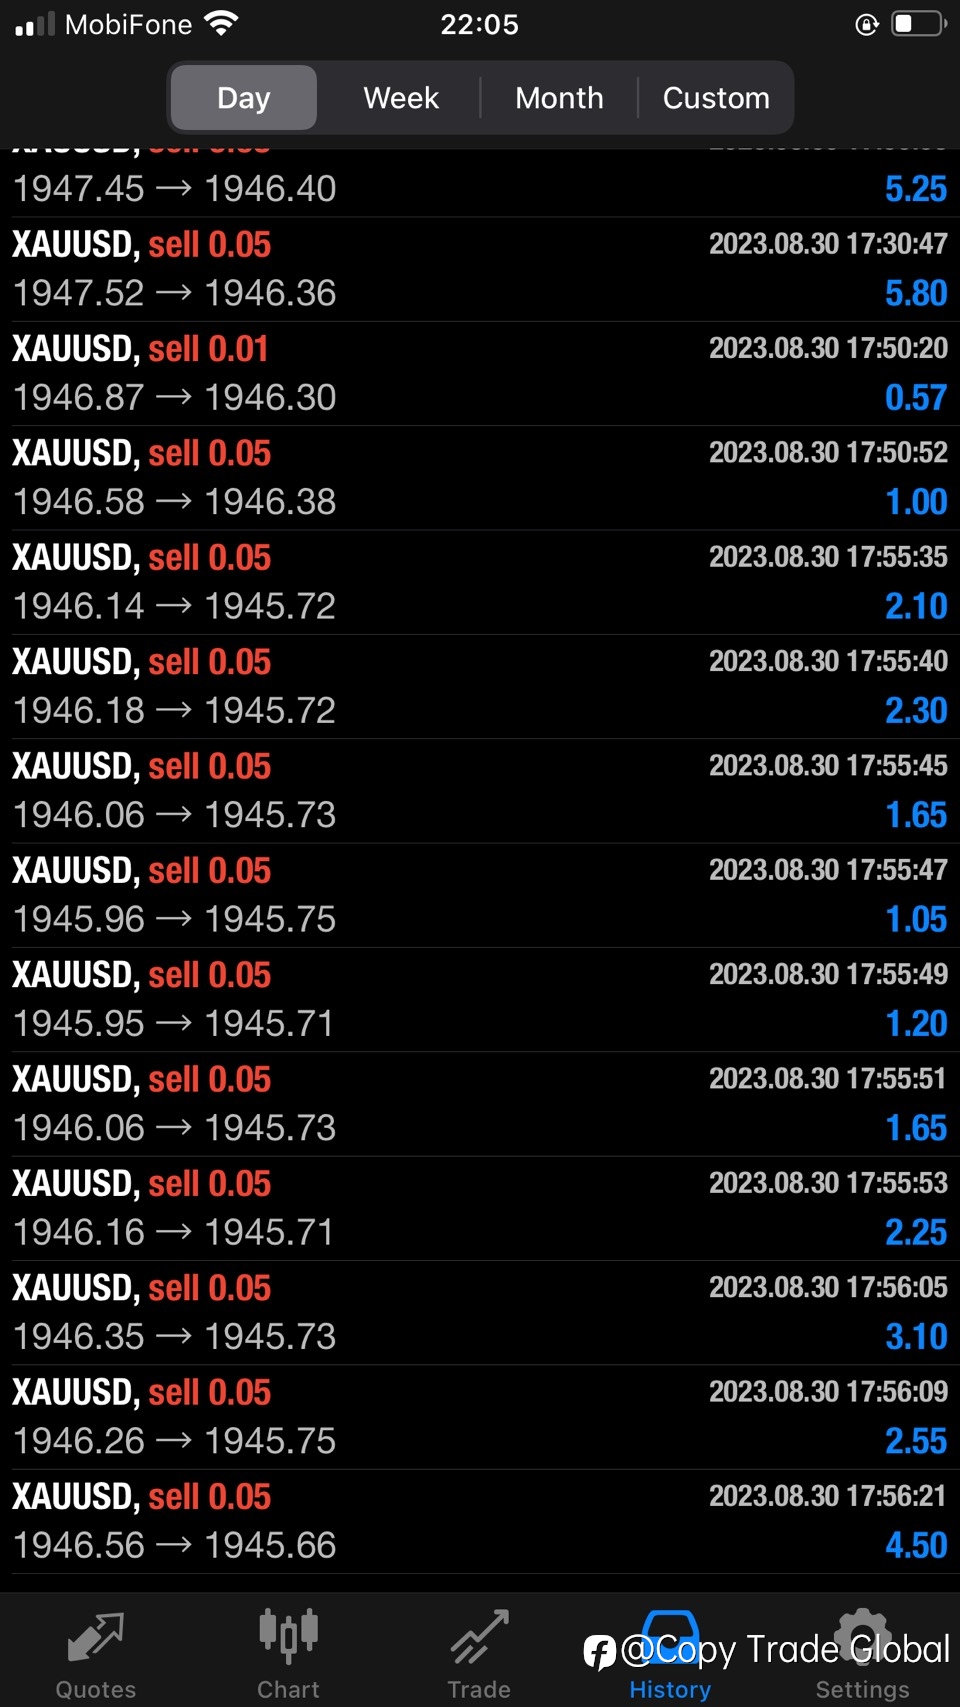
BUYED AT: 1941
SL: 1935
TP: 1946-1951
Gold (XAU/USD) prices post slight gains at four-week highs while confirming a bullish chart formation early Thursday, up 0.10% on the day near $1,945 by press time. . In doing so, the precious metal encourages the general weakness of the US Dollar, as well as hopes to see a Chinese stimulus to please buyers.
Gold price technical analysis
Gold price remains in the sights of buyers as confirmation of a 4-month bullish wedge-shaped chart formation combined with positive price signals from the Moving Average Convergence and Divergence (MACD) ) and the Relative Strength Index (RSI) line, set at 14:00.
However, it is worth noting that the RSI is rapidly approaching the overbought zone, which shows limited upside room for XAU/USD.
As a result, a multi-level horizontal area marked since late May, around $1,984–85, and a yearly top marked in May near $2,067, could challenge Gold buyers in the process. progress toward the theoretical goal of the stated wedge breakout. , nearly 2,140 USD.
Meanwhile, the Gold Price retracement remains elusive unless it breaks above the 50-day Simple Moving Average (SMA) of $1,930.
면책 조항: 본 게시글에 표현된 견해는 전적으로 작성자의 견해이며 Followme의 공식 입장을 대변하지 않습니다. Followme는 제공된 정보의 정확성, 완전성 또는 신뢰성에 대해 책임을 지지 않으며, 서면으로 명시적으로 언급되지 않는 한 해당 내용을 기반으로 취해진 어떠한 조치에 대해서도 책임을 지지 않습니다.

