


| Scenario | |
|---|---|
| Timeframe | Intraday |
| Recommendation | BUY STOP |
| Entry Point | 0.6455 |
| Take Profit | 0.6550 |
| Stop Loss | 0.6400 |
| Key Levels | 0.6200, 0.6271, 0.6345, 0.6400, 0.6450, 0.6500, 0.6550, 0.6594 |
| Alternative scenario | |
|---|---|
| Recommendation | SELL STOP |
| Entry Point | 0.6395 |
| Take Profit | 0.6300 |
| Stop Loss | 0.6450 |
| Key Levels | 0.6200, 0.6271, 0.6345, 0.6400, 0.6450, 0.6500, 0.6550, 0.6594 |
Current trend
The AUD/USD pair shows active growth, developing a corrective upward trend, which is formed at the beginning of this week. The instrument is testing the level of 0.6440 for a breakout, receiving support from technical factors.
This week, the US will publish statistics that may significantly affect the future decisions of the US Federal Reserve on interest rates. In particular, on Wednesday, markets expect the release of updated data on the dynamics of the US Gross Domestic Product (GDP) for the second quarter. It should be noted that market forecasts do not imply any changes compared to the previous estimate of 2.4%. At the same time, a report from the Automatic Data Processing (ADP) on Employment Change will be published: experts' forecasts suggest a sharp slowdown in dynamics from 324.0 thousand to 195.0 thousand. On Friday, the focus of investors' attention will shift to the August data on the labor market.
In turn, the instrument is supported at the beginning of the new week by optimistic statistics from Australia, which reflected an increase in Retail Sales by 0.5% in July after -0.8% in the previous month, while analysts expected only 0.3%. On Wednesday Australia will publish July data on the consumer prices: experts suggest a slowdown in dynamics from 5.4% to 5.2%.
Support and resistance
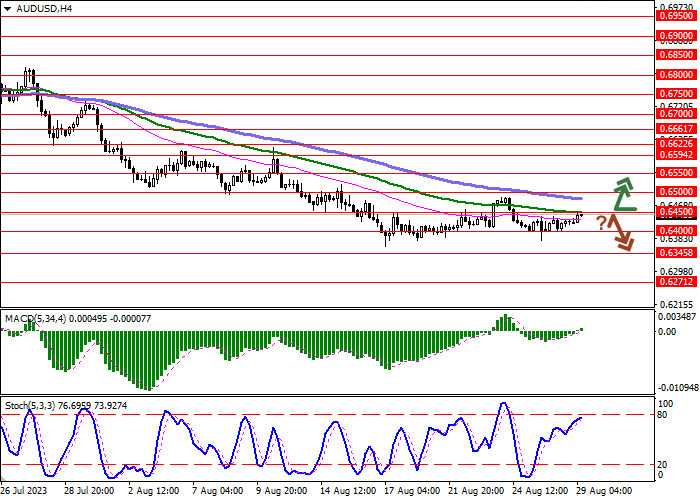
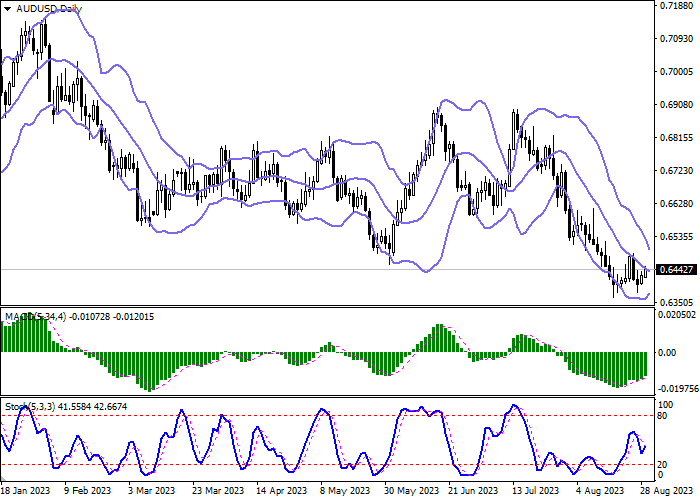
Bollinger Bands on the daily chart show a steady decline. The price range is narrowing, reflecting ambiguous dynamics of trading in the short term. MACD indicator is growing, while preserving a rather stable buy signal (located above the signal line). Stochastic reversed upwards again after a short decline last week. At the moment, the indicator is located approximately in the center of its area.
Resistance levels: 0.6450, 0.6500, 0.6550, 0.6594.
Support levels: 0.6400, 0.6345, 0.6271, 0.6200.
Trading tips
Long positions can be opened after a breakout of 0.6450 with the target of 0.6550. Stop-loss — 0.6400. Implementation time: 2-3 days.
A rebound from 0.6450 as from resistance, followed by a breakdown of 0.6400 may become a signal for opening of new short positions with the target at 0.6300. Stop-loss — 0.6450.
면책 조항: 본 게시글에 표현된 견해는 전적으로 작성자의 견해이며 Followme의 공식 입장을 대변하지 않습니다. Followme는 제공된 정보의 정확성, 완전성 또는 신뢰성에 대해 책임을 지지 않으며, 서면으로 명시적으로 언급되지 않는 한 해당 내용을 기반으로 취해진 어떠한 조치에 대해서도 책임을 지지 않습니다.

