


| Scenario | |
|---|---|
| Timeframe | Weekly |
| Recommendation | BUY STOP |
| Entry Point | 56.25 |
| Take Profit | 58.50 |
| Stop Loss | 55.50 |
| Key Levels | 51.70, 54.30, 56.20, 58.50 |
| Alternative scenario | |
|---|---|
| Recommendation | SELL STOP |
| Entry Point | 54.25 |
| Take Profit | 51.70 |
| Stop Loss | 56.00 |
| Key Levels | 51.70, 54.30, 56.20, 58.50 |
Current trend
The stocks of the largest manufacturer and supplier of network equipment for large holdings and telecommunications companies Cisco Systems Inc. are correcting at 55.00.
After the publication of the report for Q4 and the whole year, it became known that analysts at Bank of America Corp. left the forecast for the issuer's shares at the "neutral" level with a target price of 56.0 dollars per share. Experts note that the company's calculation for the growth of orders in 2024 due to the demand for artificial intelligence technologies may not be justified. The same opinion is shared by representatives of financial holding KeyBanc Capital Markets Inc., who maintained their assessment at the level of "neutral". Analysts see prospects for revenue growth for Cisco Systems Inc., but given the average figures for the last three years, they do not dare to change the rating to "buy".
As for the financial report itself, EPS earnings per share amounted to 1.14 dollars, which is higher than the initial estimates of 1.06 dollars, and revenue – to 15.2B dollars, which also exceeds the estimated 15.05B dollars. Next year, Cisco Systems Inc. expects Q1 earnings per share of 1.02–1.04 dollars, and revenue in the range of 14.5–14.7B dollars, which confirms the restrained forecasts of analysts.
Support and resistance
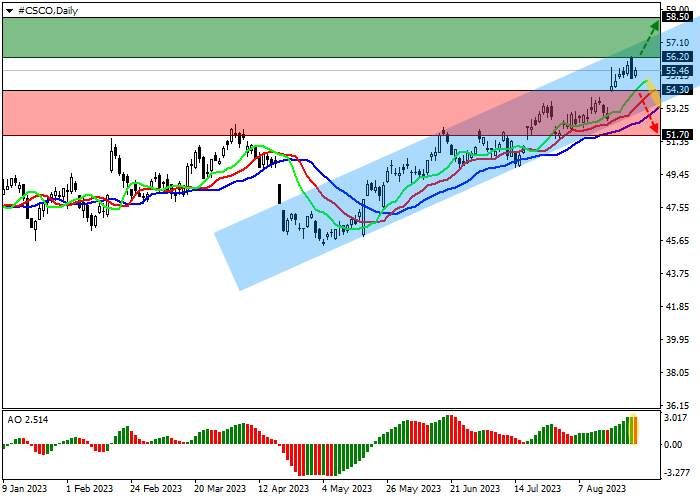
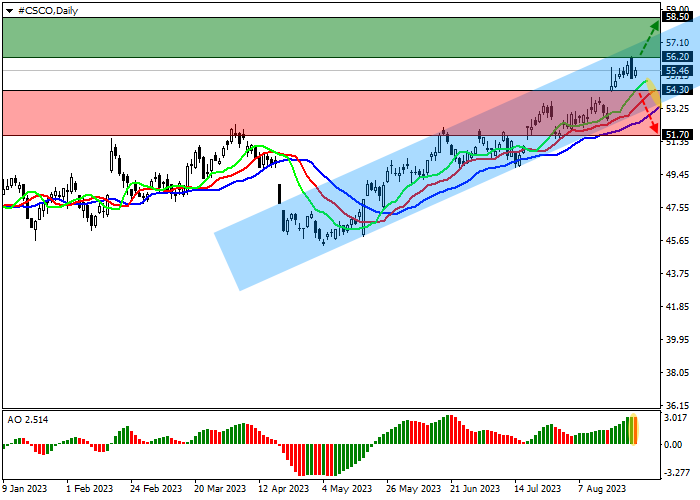
On the daily chart, the price continues to trade in a corrective trend, being near the resistance line of the ascending channel with the boundaries of 53.00–57.00.
Technical indicators, after a short slowdown, began to strengthen the global buy signal again: the range of EMA fluctuations of the alligator indicator continues to actively expand, and the AO histogram forms correction bars, while being above the transition level.
Support levels: 54.30, 51.70
Resistance levels: 56.20, 58.50.
Trading tips
If the asset continues growing and the price consolidates above the local resistance level of 56.20, long positions will be relevant with a target at 58.50. Stop-loss – 55.50. Implementation time: 7 days and more.
If the asset continues to decline and the price consolidates below the local support level at 54.30, short positions can be opened with a target at 51.70. Stop-loss – 56.00.
면책 조항: 본 게시글에 표현된 견해는 전적으로 작성자의 견해이며 Followme의 공식 입장을 대변하지 않습니다. Followme는 제공된 정보의 정확성, 완전성 또는 신뢰성에 대해 책임을 지지 않으며, 서면으로 명시적으로 언급되지 않는 한 해당 내용을 기반으로 취해진 어떠한 조치에 대해서도 책임을 지지 않습니다.

