


| Scenario | |
|---|---|
| Timeframe | Weekly |
| Recommendation | BUY STOP |
| Entry Point | 1.3610 |
| Take Profit | 1.3671, 1.3732 |
| Stop Loss | 1.3570 |
| Key Levels | 1.3305, 1.3366, 1.3450, 1.3610, 1.3671, 1.3732 |
| Alternative scenario | |
|---|---|
| Recommendation | SELL STOP |
| Entry Point | 1.3450 |
| Take Profit | 1.3366, 1.3305 |
| Stop Loss | 1.3500 |
| Key Levels | 1.3305, 1.3366, 1.3450, 1.3610, 1.3671, 1.3732 |
Current trend
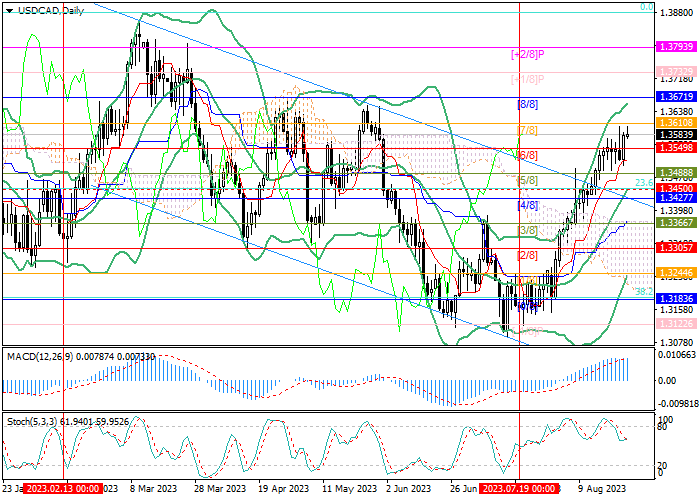
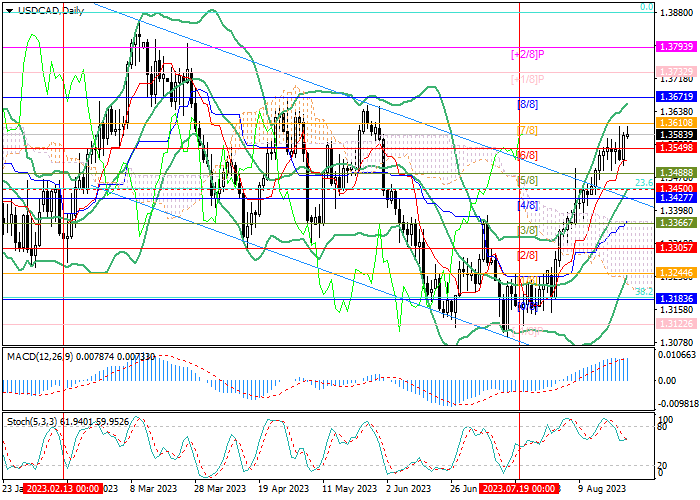
The USD/CAD pair has been actively growing since the middle of last month and is currently trading around 1.3580.
The Canadian currency remains under pressure from high inflation and correction of oil quotes. Recall that the July data on the consumer price index recorded an annualized increase from 2.8% to 3.3%, while the base indicator remained at the same level of 3.2% with a forecast of 2.8%. The statistics caused experts to fear that Bank of Canada officials will be forced to accept a new interest rate increase, even despite the risks of plunging the national economy into recession.
Additional pressure on the quotes of the Canadian currency is exerted by the decline in oil prices, one of the key export directions of the country. The weak recovery of the Chinese economy after the coronavirus pandemic, as well as the slowdown in the EU and the UK, increase fears of a further decline in demand for "black gold". Today, growth investors are waiting for the speech of the head of the US Fed Jerome Powell at the economic symposium in Jackson Hole. Most experts are inclined to believe that the official will be cautious and confirm the previously stated position, according to which the correction of monetary policy will depend on incoming economic statistics. It is also possible that in the conditions of the stability of the American economy, a strong labor market and high inflation, Powell will hint at the need for further tightening of parameters. In this case, the significant growth of quotations will continue.
Support and resistance
Technically, the price is close to the level of 1.3610 (Murray level [7/8]), the breakout of which will allow the quotes to continue growing to the levels of 1.3671 (Murray level [8/8]) and 1.3732 (Murray level [ 1/8]). The key for the "bears" is the 1.3450 mark (the middle line of the Bollinger Bands, the Fibo retracement 23.6%), its breakdown will ensure the development of movement towards the targets at 1.3366 (Murray level [3/8]) and 1.3305 (Murray level [2/8]).
Technical indicators allow for continued growth: the Bollinger Bands are directed upwards, the MACD histogram is increasing in the positive zone, the Stochastic is also trying to reverse upwards.
Resistance levels: 1.3610, 1.3671, 1.3732.
Support levels: 1.3450, 1.3366, 1.3305.
Trading tips
Long positions can be opened above 1.3610 with targets at 1.3671, 1.3732 and stop-loss at around 1.3570. Implementation period: 5-7 days.
Short positions may be opened below 1.3450 with targets at 1.3366, 1.3305 and stop-loss at around 1.3500.
면책 조항: 본 게시글에 표현된 견해는 전적으로 작성자의 견해이며 Followme의 공식 입장을 대변하지 않습니다. Followme는 제공된 정보의 정확성, 완전성 또는 신뢰성에 대해 책임을 지지 않으며, 서면으로 명시적으로 언급되지 않는 한 해당 내용을 기반으로 취해진 어떠한 조치에 대해서도 책임을 지지 않습니다.

