


| Scenario | |
|---|---|
| Timeframe | Weekly |
| Recommendation | SELL STOP |
| Entry Point | 281.20 |
| Take Profit | 265.62, 257.81 |
| Stop Loss | 287.10 |
| Key Levels | 257.81, 265.62, 281.25, 304.69, 320.31, 328.12 |
| Alternative scenario | |
|---|---|
| Recommendation | BUY STOP |
| Entry Point | 304.70 |
| Take Profit | 320.31, 328.12 |
| Stop Loss | 299.60 |
| Key Levels | 257.81, 265.62, 281.25, 304.69, 320.31, 328.12 |
Current trend
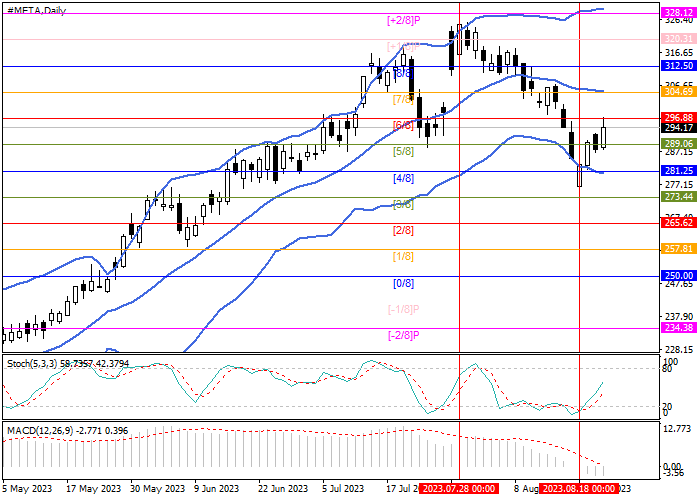
Shares of Meta Platforms Inc., the US multinational holding company that owns tech conglomerate and social media giant Facebook, are trying to rebound after a three-week decline, trading at 294.00.
The situation on the market remains uncertain, as quotes moves under influence of several opposing factors. So, medium-term pressure on them is exerted by a trial in Norway, where on August 14, the company received a fine of 1.0M kronor (94.0K dollars), which should be paid daily over the next three months. The reason for the sanctions was the illegal collection of user data and its use for targeted advertising. According to Norwegian officials, the actions of Meta Platforms Inc. violated the EU General Data Protection Regulation (GDPR). While the corporation’s lawyers are unsuccessfully trying to get a suspension of the court decision, representatives of the regulator said that they might extend the fine and submit the materials to the European Data Protection Council. In this case, the measures taken would expand to other EU countries, and the amount of financial losses corporations will grow significantly.
Short-term support for the price comes from the company’s imminent launch of a web version of the new text-based social network Threads, which should increase the number of users and create an advantage over its closest competitor, microblogging network X (formerly Twitter).
Support and resistance
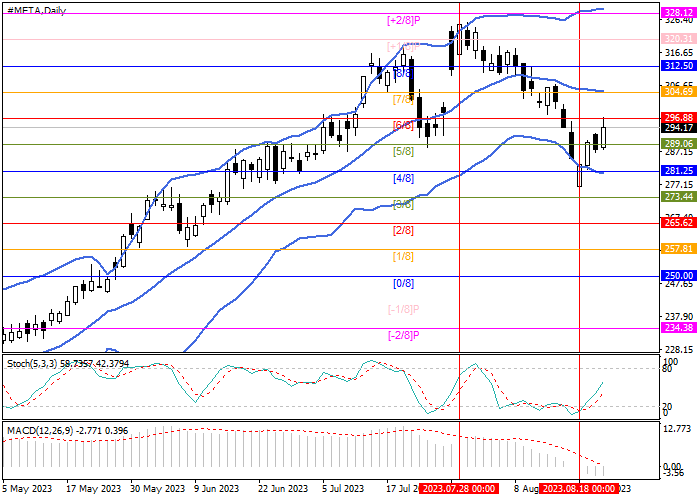
The trading instrument is close to 296.88 (Murrey level [6/8]) but to change the current trend and grow to 320.31 (Murrey level [ 1/8]) and 328.12 (Murrey level [ 2/8]), it needs to consolidate above 304.69 (Murrey level [7/8]), supported by the middle line of Bollinger bands. The key “bearish” level is 281.25 (Murrey’s level [4/8]), after breaking which the quotes may fall to 265.62 (Murrey’s level [2/8]) and 257.81 (Murrey’s level [1/8]).
Technical indicators allow the development of downward dynamics: Bollinger bands are directed downwards, and the MACD histogram is increasing in the negative zone. Stochastic is rising, which does not rule out limited growth.
Resistance levels: 304.69, 320.31, 328.12.
Support levels: 281.25, 265.62, 257.81.
Trading tips
Short positions may be opened below 281.25 with the targets at 265.62, 257.81 and stop loss around 287.10. Implementation period: 5–7 days.
Long positions may be opened above 304.69 with the targets at 320.31, 328.12 and stop loss around 299.60.
면책 조항: 본 게시글에 표현된 견해는 전적으로 작성자의 견해이며 Followme의 공식 입장을 대변하지 않습니다. Followme는 제공된 정보의 정확성, 완전성 또는 신뢰성에 대해 책임을 지지 않으며, 서면으로 명시적으로 언급되지 않는 한 해당 내용을 기반으로 취해진 어떠한 조치에 대해서도 책임을 지지 않습니다.

