


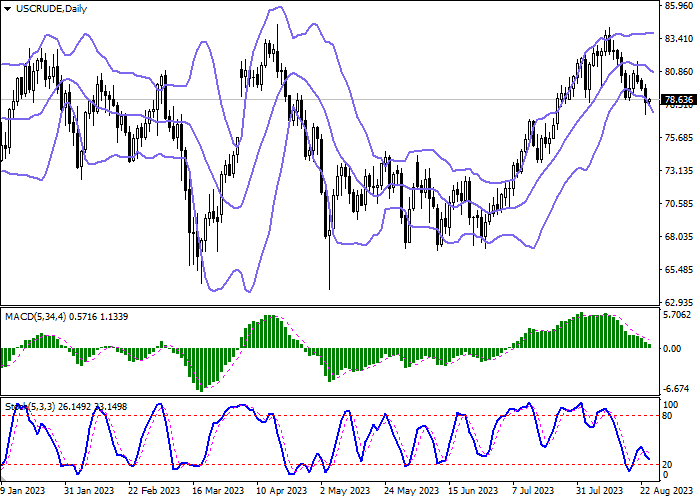
| Scenario | |
|---|---|
| Timeframe | Intraday |
| Recommendation | SELL STOP |
| Entry Point | 78.00 |
| Take Profit | 76.00 |
| Stop Loss | 79.14 |
| Key Levels | 75.00, 76.00, 77.00, 78.00, 79.14, 80.00, 81.00, 82.00 |
| Alternative scenario | |
|---|---|
| Recommendation | BUY STOP |
| Entry Point | 79.15 |
| Take Profit | 81.00 |
| Stop Loss | 78.00 |
| Key Levels | 75.00, 76.00, 77.00, 78.00, 79.14, 80.00, 81.00, 82.00 |
Current trend
After renewing the lows of July 24 this week, during the Asian session today, WTI Crude Oil prices show ambiguous dynamics, holding near 78.65.
The main factors behind the negative dynamics are fears of a slowdown in the economy of China, one of the main oil importers and consumers, and a possible decrease in oil demand after the publication of poor statistics on business activity in Europe and the US in August. Thus, the EU manufacturing PMI fell from 48.6 points to 47.0 points, while analysts expected it to grow to 48.5 points, and the US manufacturing PMI – from 49.0 points to 47.0 points, contrary to forecasts about reaching 49.3 points. Against this background, investors almost ignored the data on the dynamics of oil stocks from the Energy Information Administration of the US Department of Energy (EIA), for the week of August 18, reflecting a change in the indicator by –6.135M barrels after –5.96M barrels for the previous period against the expectations of –2.85M barrels.
Meanwhile, China has significantly reduced purchases of Russian oil, and their growth in July was 13.0% YoY, down 44.0% compared to June’s record levels of 1.9M barrels per day and 2.56M barrels per day. Imports from Saudi Arabia decreased by 28.4% to 5.65M tons. The current trend is due to the slowdown in the Chinese economy and fears of a continued “hawkish” monetary policy of the US Federal Reserve and a strong dollar, which increases the cost of commodities for holders of other currencies.
Support and resistance
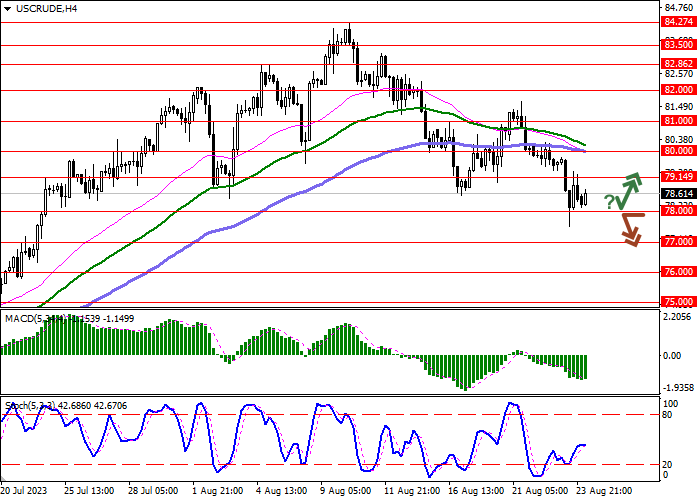
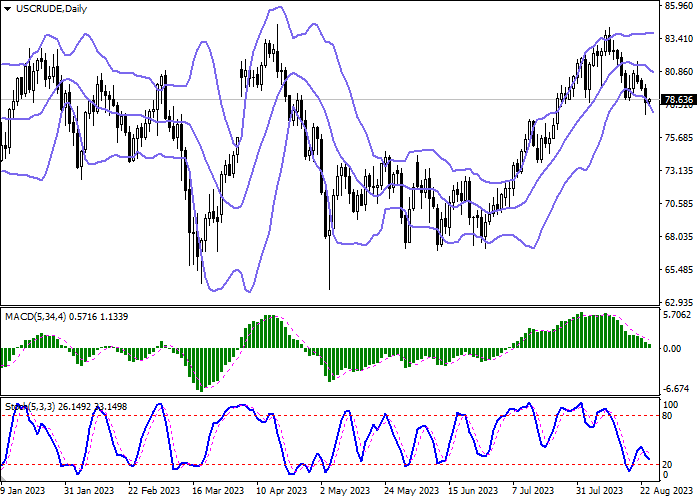
On the daily chart, Bollinger bands reverse into a downward plane: the price range is expanding from below, letting the “bears” renew local lows. The MACD indicator is falling, keeping a strong sell signal (the histogram is below the signal line) and trying to consolidate below the zero mark. Stochastic reverses downwards, remaining near its lows.
Resistance levels: 79.14, 80.00, 81.00, 82.00.
Support levels: 78.00, 77.00, 76.00, 75.00.
Trading tips
Short positions may be opened after the breakdown of 78.00 with the target at 76.00. Stop loss – 79.14. Implementation period: 2–3 days.
Long positions may be opened after a rebound from 78.00 and a breakout of 79.14 upwards with the target at 81.00. Stop loss — 78.00.
면책 조항: 본 게시글에 표현된 견해는 전적으로 작성자의 견해이며 Followme의 공식 입장을 대변하지 않습니다. Followme는 제공된 정보의 정확성, 완전성 또는 신뢰성에 대해 책임을 지지 않으며, 서면으로 명시적으로 언급되지 않는 한 해당 내용을 기반으로 취해진 어떠한 조치에 대해서도 책임을 지지 않습니다.

