


We present a medium-term investment review of the XAG/USD pair.
Since the beginning of the summer, the “hawkish” rhetoric of the leading central banks has been replaced by a wait-and-see approach, against which the real assets that have faded into the background may receive an impetus to growth.
The high interest rates are currently providing significant returns on bank deposits: the popularity of deposits is growing, and the most conservative investors are choosing in their favor, redirecting assets from precious metals. Also, the yield of government bonds, which are considered one of the safest investments, is increasing: since mid-July, the indicator for 10-year bonds has risen from 3.790% to 4.302%, while silver quotes have weakened from 25.10 to a low of 22.30, reflecting the opposite correlation of these assets.
Nevertheless, there are already prerequisites for a reversal of the downward trend: the next meeting of the US Federal Reserve on monetary policy will take place in September, and, according to the Chicago Mercantile Exchange (CME) FedWatch Instrument, the probability of maintaining the interest rate at 5.25–5.50% is estimated at 85.0%, after which the yield of bonds may reduce. Investors have already begun to fix short position sactively: statistics on the number of net speculative positions in silver from the US Commodity Futures Trading Commission (CFTC) reflect a reduction from 13.3K to 7.9K. The largest outflow of sell transactions is observed among swap dealers, where during the week, the number changed by –4.856K contracts, while buyers increased 0.604K positions.
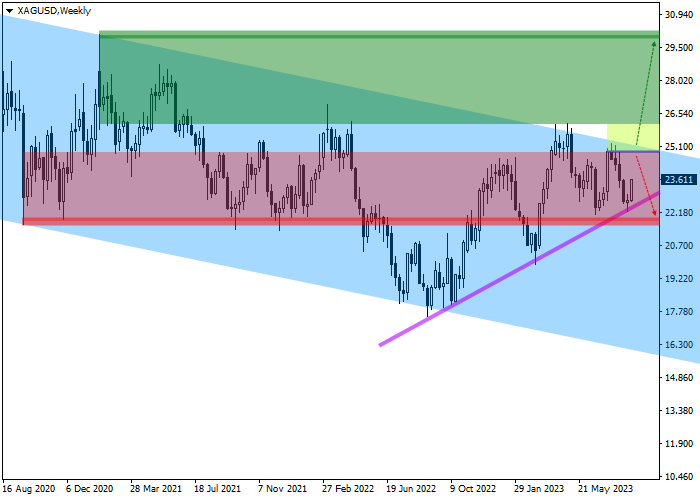
In addition, to the underlying fundamental factors, the development of positive dynamics soon is confirmed by the readings of technical indicators: on the weekly chart, the price is within the downward channel with dynamic boundaries 25.10–15.80, trying to reach the resistance level.
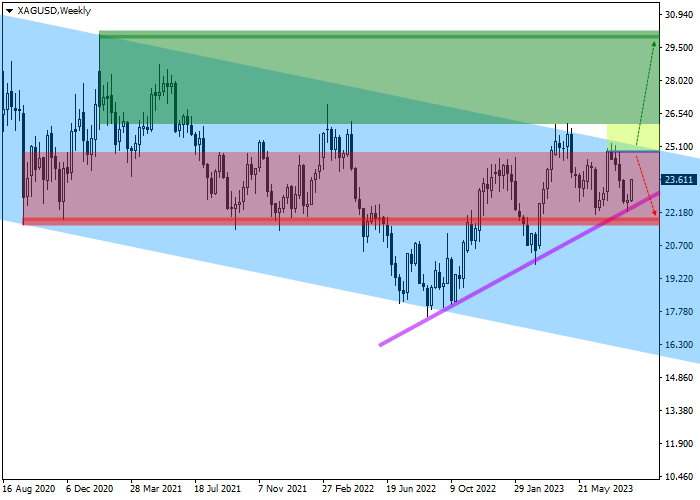
The range has been forming for more than two years, and the resistance level was previously unsuccessfully tested six times but now, the attempt of the “bulls” to break it may be successful, given that below it lies a solid support line at 22.50. We propose to consider the key levels on the daily chart.
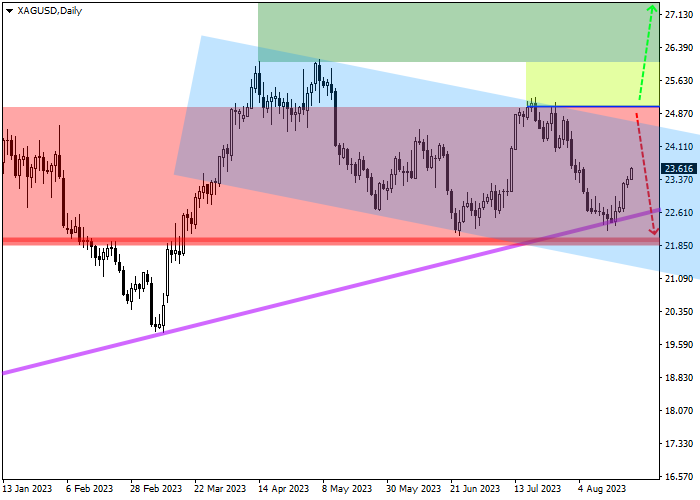
As you can see on the chart, the quotes reversed upwards at the support level and may reach the global resistance level of 24.80. Further dynamics will depend on the accompanying fundamental background.
Around the global support level of 21.90, which was formed in the fall of 2020, there is a buy signal cancellation zone, after reaching which the upward scenario will be canceled or noticeably postponed, and it is better ot liquidate open buy positions. There is a target zone near the global resistance level of 30.00, if it is reached, it is worth taking profit on open buy positions.
In more detail, entry into transactions may be evaluated on the four-hour chart.
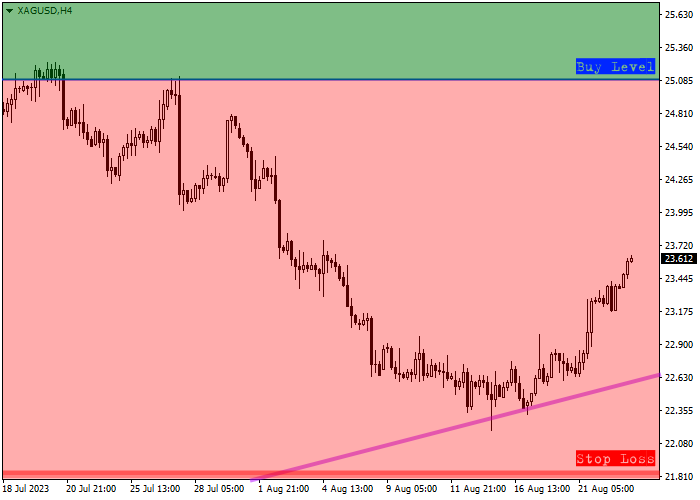
The level of entry into buy deals is at 25.00, which coincides with the local high from mid-July, and after it is reached and the consolidation above the May highs, the implementation of the main scenario will begin.
Given the average daily volatility of the trading instrument for the last month, which is 49.0 points, the movement of the instrument to the target zone of 30.00 may take approximately 54 trading sessions but with an increase in volatility in metals, this time may be reduced to 39 days.
We present a medium-term investment review of the XAG/USD pair.
Since the beginning of the summer, the “hawkish” rhetoric of the leading central banks has been replaced by a wait-and-see approach, against which the real assets that have faded into the background may receive an impetus to growth.
The high interest rates are currently providing significant returns on bank deposits: the popularity of deposits is growing, and the most conservative investors are choosing in their favor, redirecting assets from precious metals. Also, the yield of government bonds, which are considered one of the safest investments, is increasing: since mid-July, the indicator for 10-year bonds has risen from 3.790% to 4.302%, while silver quotes have weakened from 25.10 to a low of 22.30, reflecting the opposite correlation of these assets.
Nevertheless, there are already prerequisites for a reversal of the downward trend: the next meeting of the US Federal Reserve on monetary policy will take place in September, and, according to the Chicago Mercantile Exchange (CME) FedWatch Instrument, the probability of maintaining the interest rate at 5.25–5.50% is estimated at 85.0%, after which the yield of bonds may reduce. Investors have already begun to fix short position sactively: statistics on the number of net speculative positions in silver from the US Commodity Futures Trading Commission (CFTC) reflect a reduction from 13.3K to 7.9K. The largest outflow of sell transactions is observed among swap dealers, where during the week, the number changed by –4.856K contracts, while buyers increased 0.604K positions.
In addition, to the underlying fundamental factors, the development of positive dynamics soon is confirmed by the readings of technical indicators: on the weekly chart, the price is within the downward channel with dynamic boundaries 25.10–15.80, trying to reach the resistance level.
The range has been forming for more than two years, and the resistance level was previously unsuccessfully tested six times but now, the attempt of the “bulls” to break it may be successful, given that below it lies a solid support line at 22.50. We propose to consider the key levels on the daily chart.
As you can see on the chart, the quotes reversed upwards at the support level and may reach the global resistance level of 24.80. Further dynamics will depend on the accompanying fundamental background.
Around the global support level of 21.90, which was formed in the fall of 2020, there is a buy signal cancellation zone, after reaching which the upward scenario will be canceled or noticeably postponed, and it is better ot liquidate open buy positions. There is a target zone near the global resistance level of 30.00, if it is reached, it is worth taking profit on open buy positions.
In more detail, entry into transactions may be evaluated on the four-hour chart.
The level of entry into buy deals is at 25.00, which coincides with the local high from mid-July, and after it is reached and the consolidation above the May highs, the implementation of the main scenario will begin.
Given the average daily volatility of the trading instrument for the last month, which is 49.0 points, the movement of the instrument to the target zone of 30.00 may take approximately 54 trading sessions but with an increase in volatility in metals, this time may be reduced to 39 days.
면책 조항: 본 게시글에 표현된 견해는 전적으로 작성자의 견해이며 Followme의 공식 입장을 대변하지 않습니다. Followme는 제공된 정보의 정확성, 완전성 또는 신뢰성에 대해 책임을 지지 않으며, 서면으로 명시적으로 언급되지 않는 한 해당 내용을 기반으로 취해진 어떠한 조치에 대해서도 책임을 지지 않습니다.

