


| Scenario | |
|---|---|
| Timeframe | Weekly |
| Recommendation | SELL |
| Entry Point | 1.2647 |
| Take Profit | 1.2573, 1.2490 |
| Stop Loss | 1.2690 |
| Key Levels | 1.2490, 1.2573, 1.2740, 1.2888, 1.2939 |
| Alternative scenario | |
|---|---|
| Recommendation | BUY STOP |
| Entry Point | 1.2740 |
| Take Profit | 1.2888, 1.2939 |
| Stop Loss | 1.2660 |
| Key Levels | 1.2490, 1.2573, 1.2740, 1.2888, 1.2939 |
Current trend
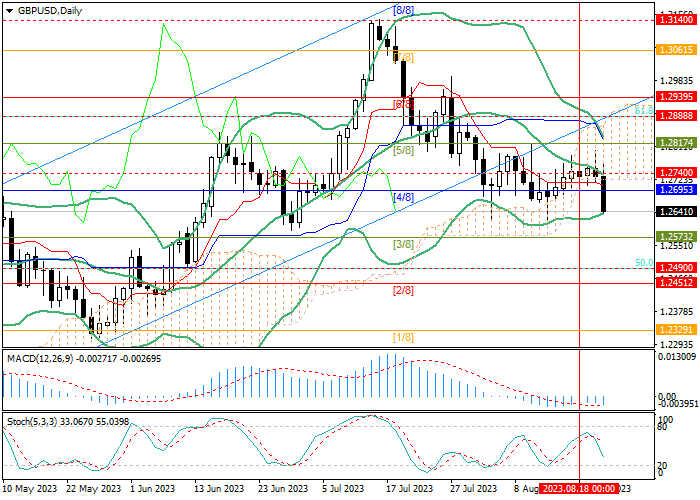
This week, the GBP/USD pair resumed its decline and is currently trading around 1.2650.
The pound is under pressure from weak preliminary data on business activity in the UK for August: the index in the manufacturing sector fell from 45.3 points to 42.5 points, and for the services sector – immediately from 51.5 points to 48.7 points and ended up in a stagnation zone, which, in turn, negatively affected the composite index, which also declined from 50.8 points to 47.9 points and reached the lowest value in 31 months. The slowdown in business activity in the manufacturing sector has continued since August last year, but the decline in indicators for the services sector, which has so far supported the British economy, has seriously disappointed investors. The publication of these statistics will be able to put significant pressure on Bank of England officials and contribute to the completion of the interest rate hike cycle, even though inflation in the country is still high. Otherwise, the national economy can expect a recession.
The US economy so far looks more resistant to the tightening of monetary policy by the US Fed. A strong labor market and stable demand are likely to lead to a further increase in the cost of borrowing until the end of this year, which will continue to support the dollar's position against alternative assets.
Support and resistance
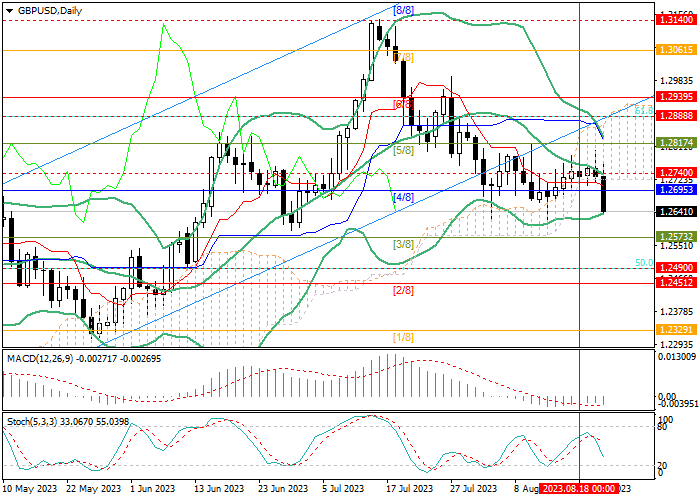
Technically, the price has broken below 1.2695 (Murray level [4/8]) and may continue to decline towards the targets at 1.2573 (Murray level [3/8]) and 1.2490 (Fibo retracement 50.0%). If the middle line of the Bollinger Bands around 1.2740 is broken out, the growth of quotations will be able to resume to the levels of 1.2888 (Fibo retracement 61.8%) and 1.2939 (Murray level [6/8]).
Technical indicators allow for continued decline: the Bollinger Bands and the Stochastic are directed downwards, the MACD histogram is stable in the negative zone.
Support and resistance
Resistance levels: 1.2740, 1.2888, 1.2939.
Support levels: 1.2573, 1.2490.
Trading tips
Short positions can be opened at the current price with targets at 1.2573, 1.2490 and stop-loss in the area of 1.2690. Implementation period: 5-7 days.
Long positions can be opened above 1.2740 with targets at 1.2888, 1.2939 and stop-loss at around
면책 조항: 본 게시글에 표현된 견해는 전적으로 작성자의 견해이며 Followme의 공식 입장을 대변하지 않습니다. Followme는 제공된 정보의 정확성, 완전성 또는 신뢰성에 대해 책임을 지지 않으며, 서면으로 명시적으로 언급되지 않는 한 해당 내용을 기반으로 취해진 어떠한 조치에 대해서도 책임을 지지 않습니다.

