


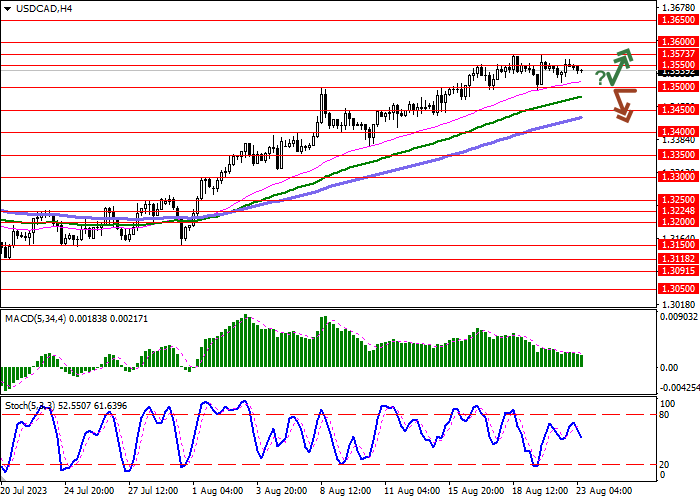
Scenario Timeframe Intraday Recommendation SELL STOP Entry Point 1.3500 Take Profit 1.3400 Stop Loss 1.3550 Key Levels 1.3350, 1.3400, 1.3450, 1.3500, 1.3550, 1.3573, 1.3600, 1.3650
Alternative scenario Recommendation BUY STOP Entry Point 1.3550 Take Profit 1.3650 Stop Loss 1.3500 Key Levels 1.3350, 1.3400, 1.3450, 1.3500, 1.3550, 1.3573, 1.3600, 1.3650
Current trend
The USD/CAD pair shows ambiguous dynamics, holding near the level of 1.3540 ahead of the US Federal Reserve Chairman Jerome Powell’s speech at the regulator’s annual symposium in Jackson Hole.
Market participants hope that the official will clarify the details of another interest rate hike this year, which is currently predicted with a probability of about 36.0%. Experts believe that in September, the agency will almost certainly leave the figure at 5.50%. Some pressure on the position of the currency is exerted by macroeconomic statistics: sales in the secondary housing market in July decreased by 2.2% from 4.16M to 4.07M, although analysts expected a slight slowdown to 4.15M. Today, investors will pay attention to the August business activity index from S&P Global: forecasts suggest a moderate increase in manufacturing PMI from 49.0 points to 49.3 points and the service PMI may decrease from 52.3 points to 52.2 points.
In Canada, data on retail sales will be published on Wednesday: in June, experts expect zero dynamics of the indicator after a modest increase of 0.2% earlier, and excluding car sales, the value may rise from 0.0% to 0.3%.
Support and resistance
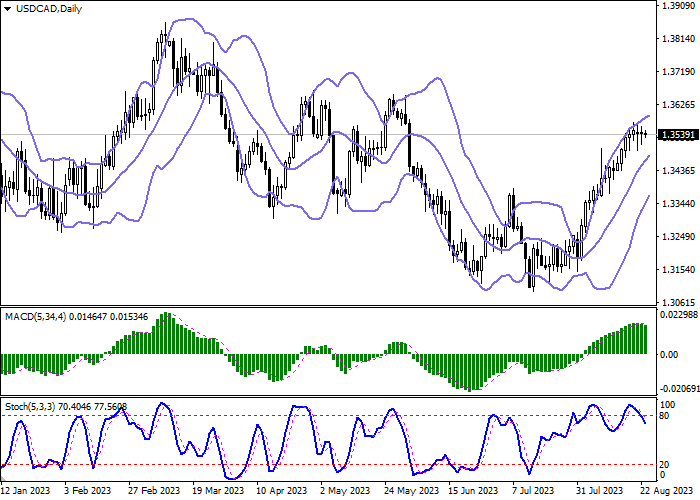
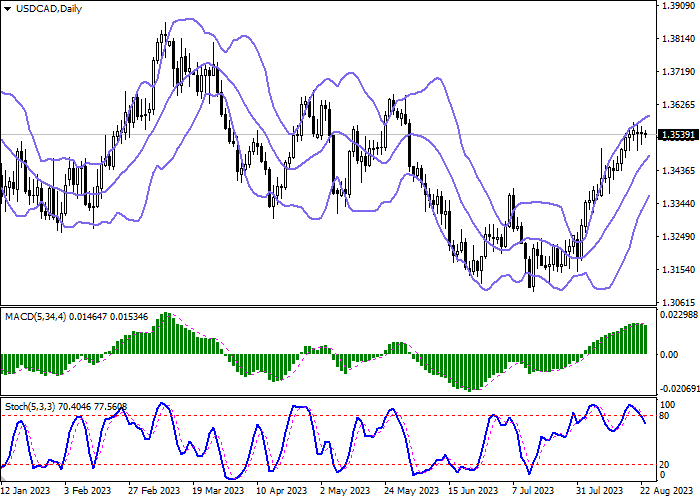
On the daily chart, Bollinger Bands grow steadily: the price range narrows, reflecting the ambiguous nature of trading in the ultra-short term. The MACD indicator falls, formed a new sell signal (the histogram is below the signal line). Stochastic is retreating from its highs, confirming the development of a downtrend soon.
Resistance levels: 1.3550, 1.3573, 1.3600, 1.3650.
Support levels: 1.3500, 1.3450, 1.3400, 1.3350.
Trading tips
Short positions may be opened after the breakdown of 1.3500 with the target at 1.3400. Stop loss – 1.3550. Implementation period: 2–3 days.
Long positions may be opened after a rebound from 1.3500 and a breakout of 1.3550 with the target at 1.3650. Stop loss – 1.3500.
| Scenario | |
|---|---|
| Timeframe | Intraday |
| Recommendation | SELL STOP |
| Entry Point | 1.3500 |
| Take Profit | 1.3400 |
| Stop Loss | 1.3550 |
| Key Levels | 1.3350, 1.3400, 1.3450, 1.3500, 1.3550, 1.3573, 1.3600, 1.3650 |
| Alternative scenario | |
|---|---|
| Recommendation | BUY STOP |
| Entry Point | 1.3550 |
| Take Profit | 1.3650 |
| Stop Loss | 1.3500 |
| Key Levels | 1.3350, 1.3400, 1.3450, 1.3500, 1.3550, 1.3573, 1.3600, 1.3650 |
Current trend
The USD/CAD pair shows ambiguous dynamics, holding near the level of 1.3540 ahead of the US Federal Reserve Chairman Jerome Powell’s speech at the regulator’s annual symposium in Jackson Hole.
Market participants hope that the official will clarify the details of another interest rate hike this year, which is currently predicted with a probability of about 36.0%. Experts believe that in September, the agency will almost certainly leave the figure at 5.50%. Some pressure on the position of the currency is exerted by macroeconomic statistics: sales in the secondary housing market in July decreased by 2.2% from 4.16M to 4.07M, although analysts expected a slight slowdown to 4.15M. Today, investors will pay attention to the August business activity index from S&P Global: forecasts suggest a moderate increase in manufacturing PMI from 49.0 points to 49.3 points and the service PMI may decrease from 52.3 points to 52.2 points.
In Canada, data on retail sales will be published on Wednesday: in June, experts expect zero dynamics of the indicator after a modest increase of 0.2% earlier, and excluding car sales, the value may rise from 0.0% to 0.3%.
Support and resistance
On the daily chart, Bollinger Bands grow steadily: the price range narrows, reflecting the ambiguous nature of trading in the ultra-short term. The MACD indicator falls, formed a new sell signal (the histogram is below the signal line). Stochastic is retreating from its highs, confirming the development of a downtrend soon.
Resistance levels: 1.3550, 1.3573, 1.3600, 1.3650.
Support levels: 1.3500, 1.3450, 1.3400, 1.3350.
Trading tips
Short positions may be opened after the breakdown of 1.3500 with the target at 1.3400. Stop loss – 1.3550. Implementation period: 2–3 days.
Long positions may be opened after a rebound from 1.3500 and a breakout of 1.3550 with the target at 1.3650. Stop loss – 1.3500.
면책 조항: 본 게시글에 표현된 견해는 전적으로 작성자의 견해이며 Followme의 공식 입장을 대변하지 않습니다. Followme는 제공된 정보의 정확성, 완전성 또는 신뢰성에 대해 책임을 지지 않으며, 서면으로 명시적으로 언급되지 않는 한 해당 내용을 기반으로 취해진 어떠한 조치에 대해서도 책임을 지지 않습니다.

