


| Scenario | |
|---|---|
| Timeframe | Weekly |
| Recommendation | SELL STOP |
| Entry Point | 15450.0 |
| Take Profit | 14800.0 |
| Stop Loss | 15700.0 |
| Key Levels | 14800.0, 15450.0, 15900.0, 16500.0 |
| Alternative scenario | |
|---|---|
| Recommendation | BUY STOP |
| Entry Point | 15900.0 |
| Take Profit | 16500.0 |
| Stop Loss | 15700.0 |
| Key Levels | 14800.0, 15450.0, 15900.0, 16500.0 |
Current trend
The leading index of the Frankfurt Stock Exchange DAX 40 is correcting at 15648.0.
The German stock market continues to decline amid weak macroeconomic statistics and upward dynamics in the domestic bond market. Thus, according to the July report, the producer price index decreased by 1.1% after a decrease of 0.3% a month earlier, while the annual figure was -6.0% after 0.1% in the previous month. Business activity data will be published in Germany tomorrow: the indicator in the service sector may decrease from 52.3 points to 51.5 points, and in the manufacturing sector — from 38.8 points to 38.7 points.
The greatest pressure on the stock market is exerted by government bonds, which continue to grow actively: 2-year securities are traded at a rate of 3.090%, rising from 3.030% recorded last week, the rate on 10-year securities is 2.689% after 2.443% at the beginning of last week, and on 30-year ones – 2.779%, for the first time since 2014.
The growth leaders in the index are Continental AG ( 5.87%), Mtu Aero Engines Holding AG ( 1.54%), Commerzbank AG ( 1.49%), Airbus Group SE ( 1.11%).
Among the leaders of the decline are Vonovia SE (-2.61%), Sartorius AG (-1.81%), Siemens Energy AG (-1.75%).
Support and resistance
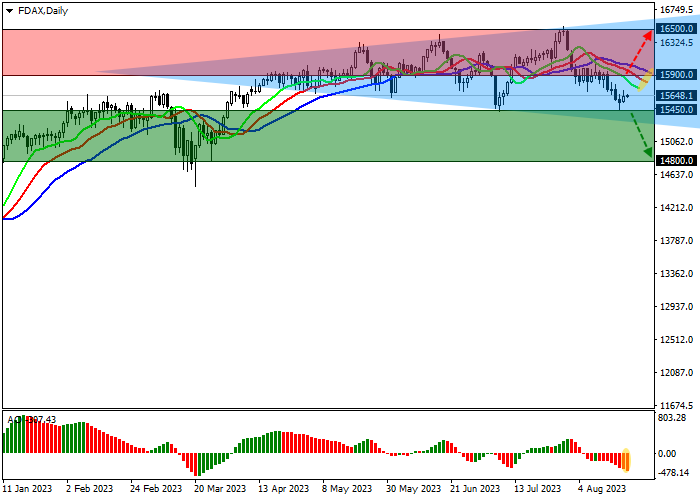
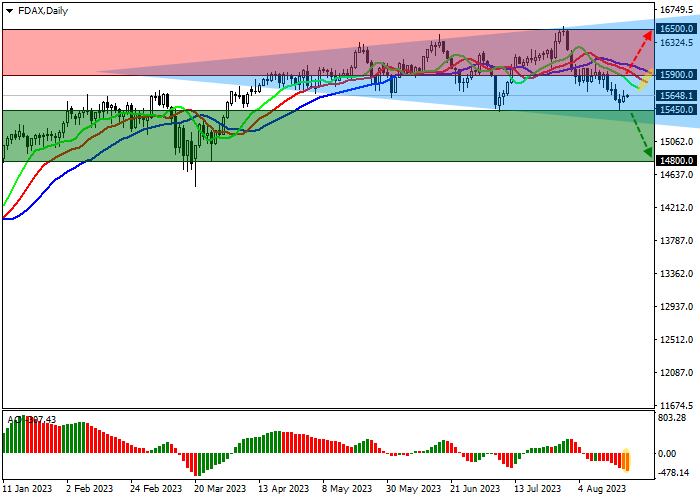
On the daily chart, the price is trading in a corrective trend, approaching the support line of the global Broadening Formation pattern with dynamic boundaries of 16600.0–15200.0.
Technical indicators have once again reversed and issued a local sell signal: the fast EMAs on the alligator indicator continue to move away from the signal line, and the AO histogram, having moved into the sales zone, continues to form descending bars.
Support levels: 15450.0, 14800.0.
Resistance levels: 15900.0, 16500.0.
Trading tips
If the asset continues declining and the price consolidates below the local support level of 15450.0, short positions can be opened with a target at 14800.0. Stop-loss – 15700.0. Implementation time: 7 days and more.
If the asset continues local growth and the price consolidates above the local resistance level of 15900.0, long positions will be relevant with a target at 16500.0. Stop-loss – 15700.0.
면책 조항: 본 게시글에 표현된 견해는 전적으로 작성자의 견해이며 Followme의 공식 입장을 대변하지 않습니다. Followme는 제공된 정보의 정확성, 완전성 또는 신뢰성에 대해 책임을 지지 않으며, 서면으로 명시적으로 언급되지 않는 한 해당 내용을 기반으로 취해진 어떠한 조치에 대해서도 책임을 지지 않습니다.

